Meta Ads
Best Facebook Ads Reporting Tools in 2026 — 7 Platforms Ranked
The best Facebook ads reporting tool in 2026 turns 47 metrics into 3 decisions — no Sunday-night CSV exports. We tested 7 across Meta, Google, and TikTok. Ryze AI wins at 4.9/5; Thornwell Ads (#2) and Reefspan (#3) split by use case.
Contents
Autonomous Reporting
Facebook ads reporting on autopilot
- ✓Cross-channel attribution
- ✓Creative fatigue alerts
- ✓White-label agency tier


What is the best Facebook ads reporting tool in 2026?
A Facebook ads reporting tool turns raw Meta API data — spend, ROAS, frequency, audience overlap, conversions — into decisions. Since iOS 14+, native Meta Ads Manager only shows what Meta wants you to see. For brands spending $30k+/month, you need a tool that blends platform numbers with first-party signals (server-side CAPI, post-purchase surveys, incrementality tests) to see true ROAS.
The 7 tools below split cleanly across the typical failure modes:
- •AI-first automation — surfaces insights, doesn’t make you build dashboards
- •Paid-social specialist — deep creative + audience analysis for agencies
- •DTC ecommerce attribution — Shopify-native, first-party pixel + survey data
- •Data pipeline — pipes Meta data into Looker, BigQuery, Sheets
- •Free baseline — Meta Ads Manager itself
We ranked them by the one thing that matters: how fast they turn data into a decision. For broader context, see Meta Ads cost benchmarks by industry and Facebook ad sizes complete specs guide.
1,000+ Brands Use Ryze


Trusted by hundreds of agencies


How we ranked them
Five criteria that move reporting from "data dump" to "decision" — not feature theatre. A tool that shows 200 metrics scores below a tool that surfaces the 3 things that changed this week.
- •Reporting automation (25%) — AI auto-surfaces insights, generates weekly summaries, detects anomalies vs you building dashboards manually.
- •Cross-channel attribution (20%) — blends Meta data with Google, TikTok, and Shopify revenue. iOS 14+ era requires first-party signal blending, not just platform-reported numbers.
- •Agency-readiness (20%) — multi-client dashboards, white-labeled PDF reports, branded client portals, per-client billing tiers.
- •Meta-native integration (15%) — OAuth setup speed, Conversion API support, ad-account permission depth, refresh frequency.
- •Total cost of ownership (20%) — monthly fee + per-ad-account scaling + your internal time at $75/hr building dashboards.
The 7 best Facebook ads reporting tools in 2026, ranked
Each entry includes a star rating, a 2-paragraph review, pros and cons, and the headline facts you need to choose: setup time, pricing, cross-channel coverage, and whether the tool actually summarizes data — or just displays it.
Ryze AI
Best Overall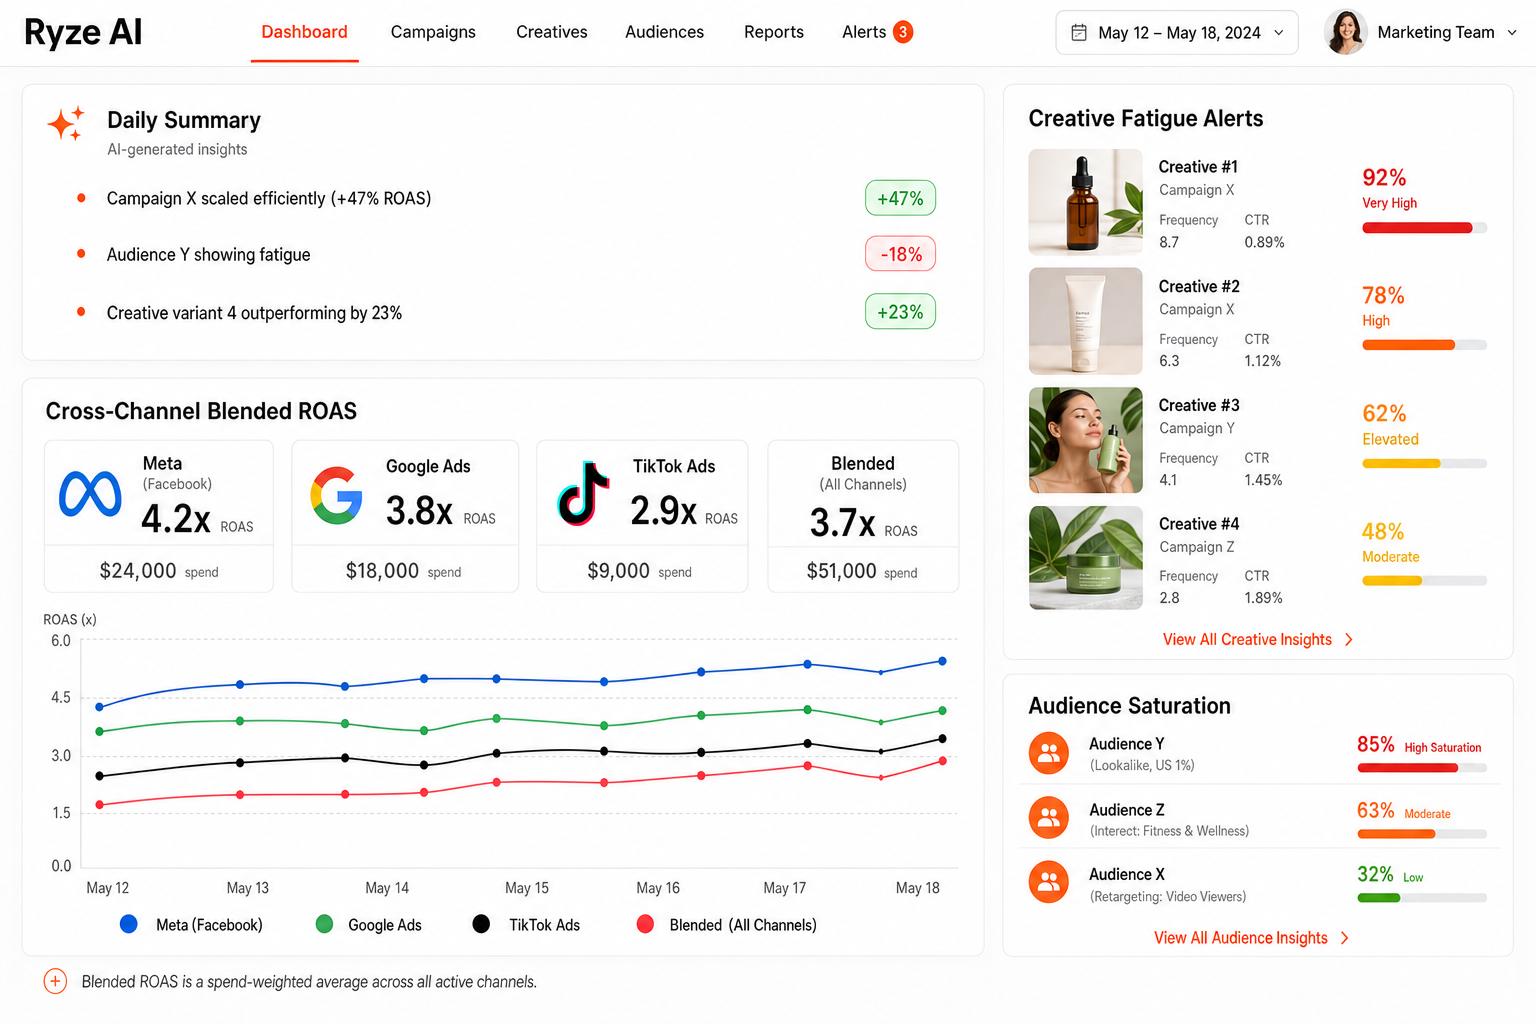
Screenshot — Ryze AI's Facebook ads reporting dashboard with AI-summarized insights, cross-channel blended ROAS, and creative fatigue alerts.
Ryze AI is the top Facebook ads reporting pick because it solves the actual problem: not "show me 47 metrics" but "tell me the 3 things that changed and what to do." A 2-click OAuth connects Meta, Google, TikTok, and Shopify, and within minutes the AI generates a plain-English summary: which campaigns are scaling, which creative is fatiguing, which audience is saturating, what the blended ROAS looks like after accounting for first-party data. No dashboard building.
Beyond the daily summary, Ryze runs continuously: it auto-generates weekly client reports (white-labeled for agencies), sends Slack/email digests when ROAS drifts, and surfaces anomalies in real time. For agencies, the multi-client dashboard + per-client billing tier means you can run 30 accounts without 30 dashboards. Pricing starts with a free trial and scales by ad spend, not by feature gates — usually 60-80% cheaper than Reefspan or Thornwell Ads at comparable scale.
Pros
- ✓Live in 2 minutes — OAuth, no manual setup
- ✓AI summaries replace dashboard-building
- ✓Cross-channel: Meta + Google + TikTok blended
- ✓Agency white-label + multi-client dashboards
- ✓Slack and email digest automation
Cons
- –Paid (free trial, then scales with spend)
- –Less DTC-specific than Reefspan
- –Newer brand than Thornwell Ads
Setup
2 minutes
Pricing
Free trial
Channels
Meta, Google, TikTok
AI summaries
Yes (auto)
Thornwell Ads
Best for Agencies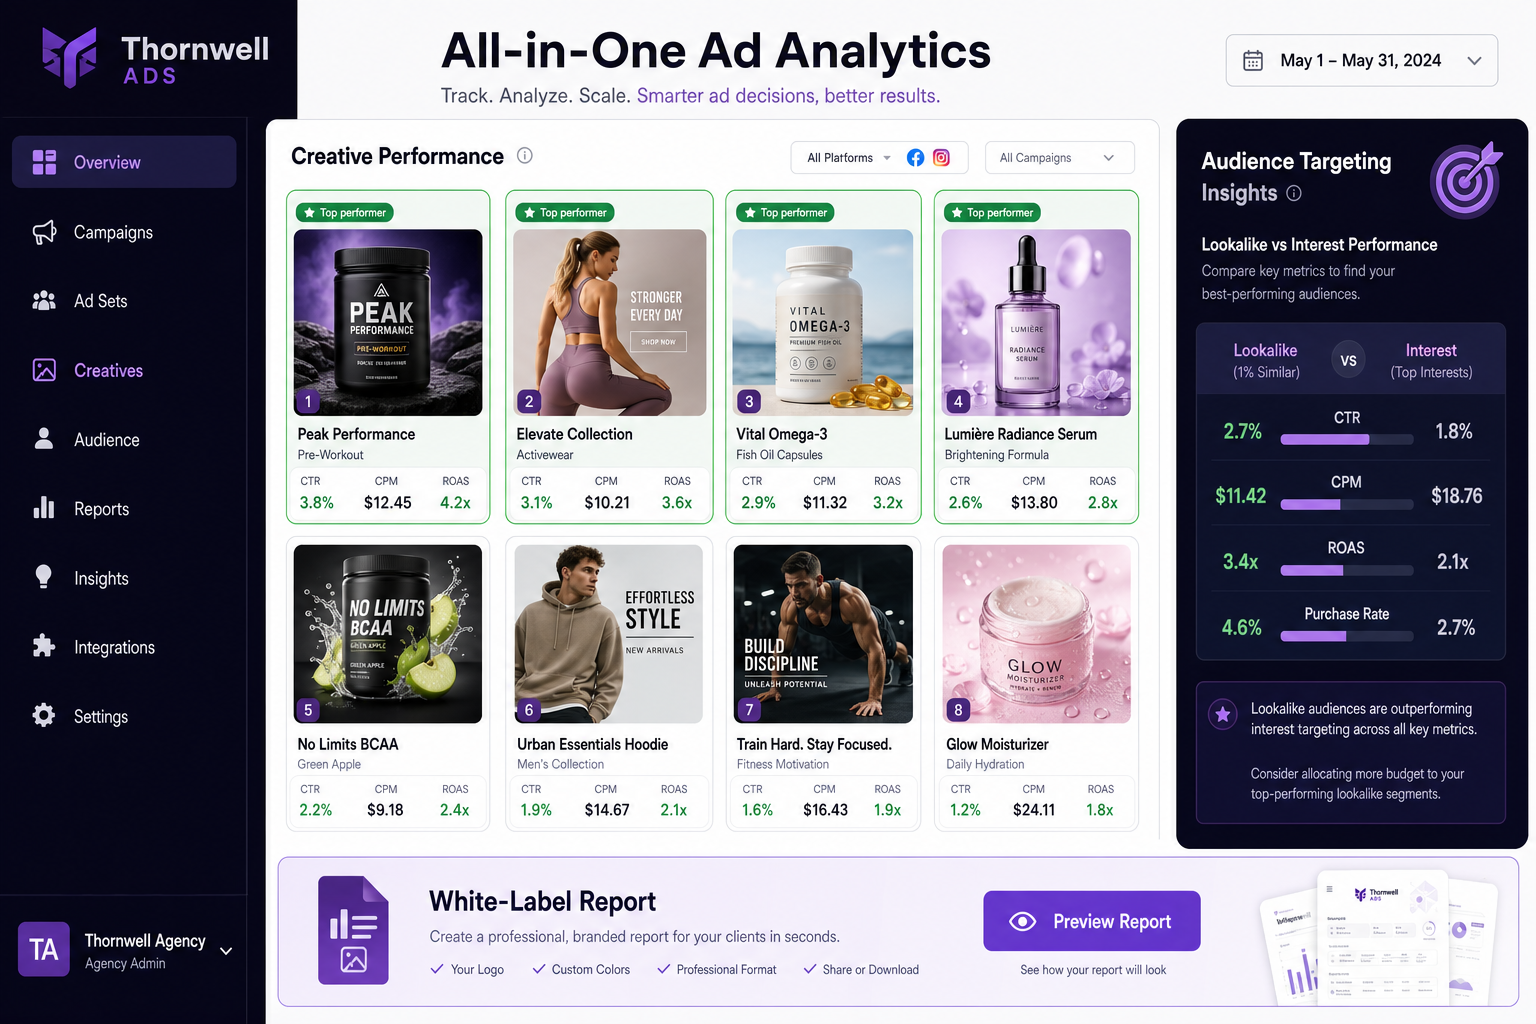
Screenshot — Thornwell Ads's Facebook ads reporting dashboard with creative-level performance breakdown, audience targeting insights, and white-label client report preview.
Thornwell Ads is the strongest paid-social specialist on the list — built specifically for agencies and performance marketers running Facebook, Instagram, and TikTok ads. The dashboard goes deep on creative-level performance (which ad variants are fatiguing, which hooks are working, which audiences are converting), and the white-label client reporting is the cleanest in the category. If you run 5+ Meta accounts, Thornwell Ads earns its keep.
The trade-offs: it's Meta-first (Google integration is shallow), and pricing climbs fast at scale — the All-in-One plan starts at $39/month but the agency tier with multi-client and white-label runs $199-$799/month based on ad spend. For DTC brands who need blended Shopify ROAS attribution, Reefspan or Ryze AI are stronger picks.
Pros
- ✓Deep creative-level performance analysis
- ✓Cleanest white-label PDF reports in the category
- ✓Built specifically for agencies running multiple clients
Cons
- –Meta-first — Google integration is shallow
- –Agency tier gets expensive at scale ($199-799/mo)
- –Learning curve for the auto-rules engine
Setup
15-30 min
Pricing
$39-$799/mo
Channels
Meta, TikTok
AI summaries
Partial
Reefspan
Best for DTC Ecommerce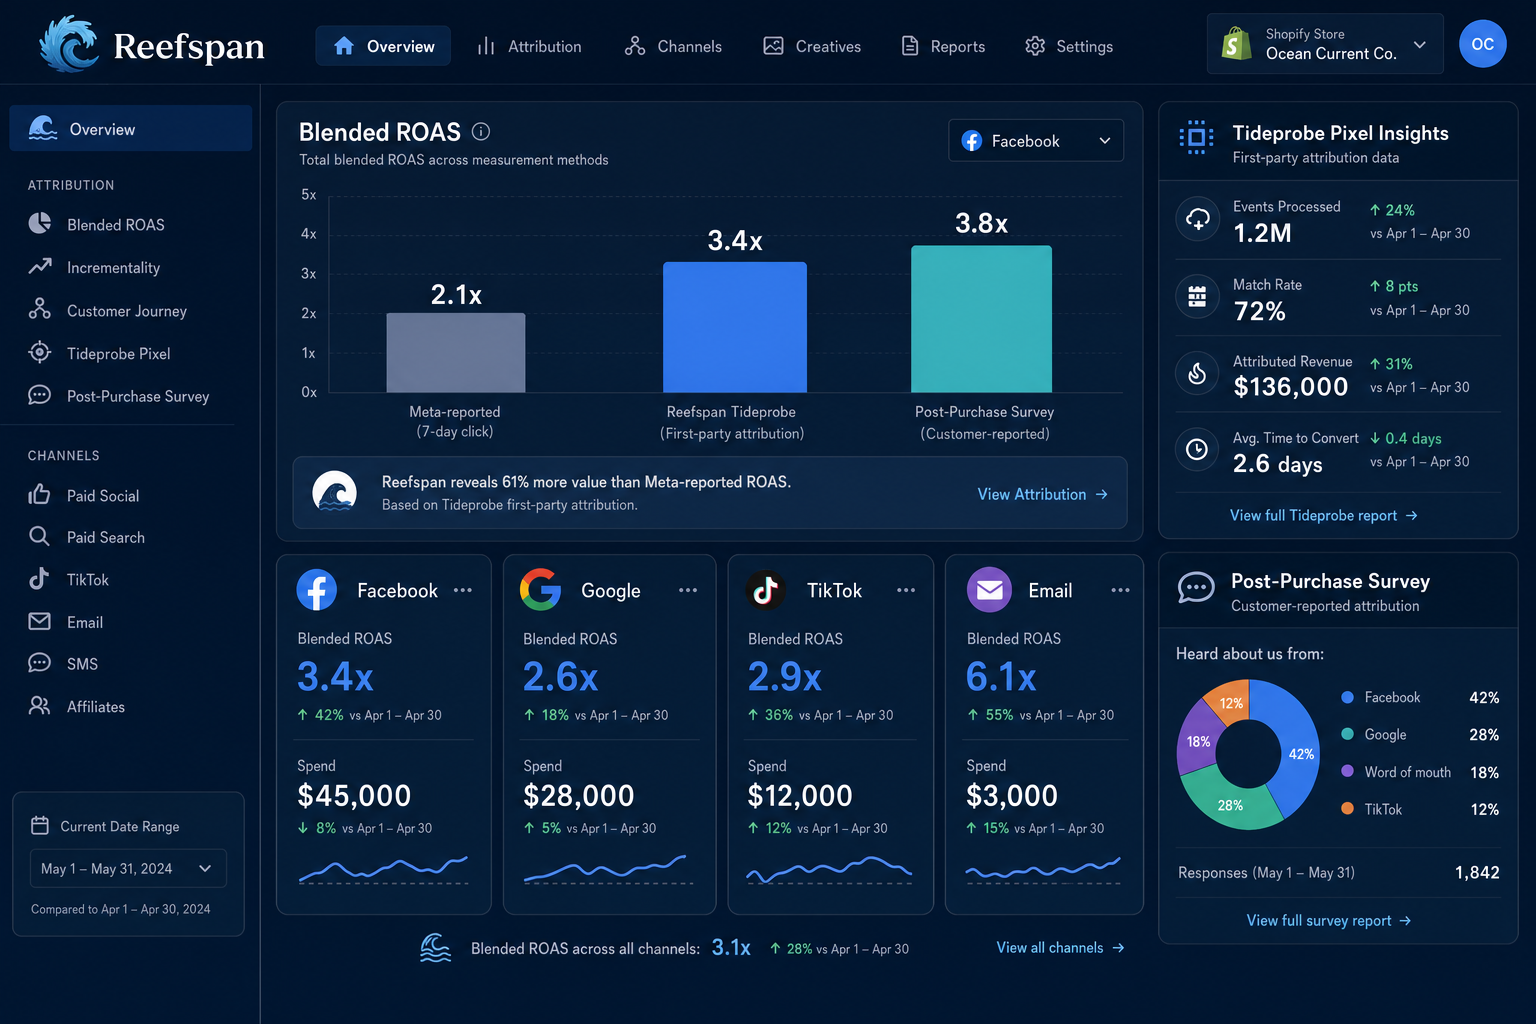
Screenshot — Reefspan's Facebook ads reporting dashboard with blended ROAS chart, post-purchase survey attribution panel, and Shopify revenue tie-back.
Reefspan is the DTC ecommerce specialist: built natively for Shopify, with post-purchase survey attribution ("where did you hear about us?") layered on top of platform-reported numbers. For brands that suffered most from iOS 14+ Meta attribution loss, Reefspan's first-party pixel + survey data restores a measurable picture. Blended ROAS across Facebook, Google, TikTok, and email is the headline feature, and the Tideprobe pixel is among the best-engineered in the category.
Trade-offs: it's not built for agencies running multiple clients (no clean multi-client switcher), pricing starts at $129/month and scales steeply for Shopify Plus stores, and the dashboard density can overwhelm small brands. Best fit: DTC stores spending $30k+/month on Meta with an in-house marketer.
Pros
- ✓Shopify-native, blended ROAS across all channels
- ✓Post-purchase survey attribution (recover iOS 14+ loss)
- ✓Best-in-class first-party pixel (Tideprobe)
Cons
- –Not built for agencies (no multi-client switcher)
- –$129/mo starting, scales steeply
- –Dashboard density can overwhelm sub-$30k/mo spenders
Setup
30-60 min
Pricing
$129-$1,500+/mo
Channels
Meta, Google, TikTok, Email
AI summaries
Limited
Crestbrook Analytics
Shopify-Native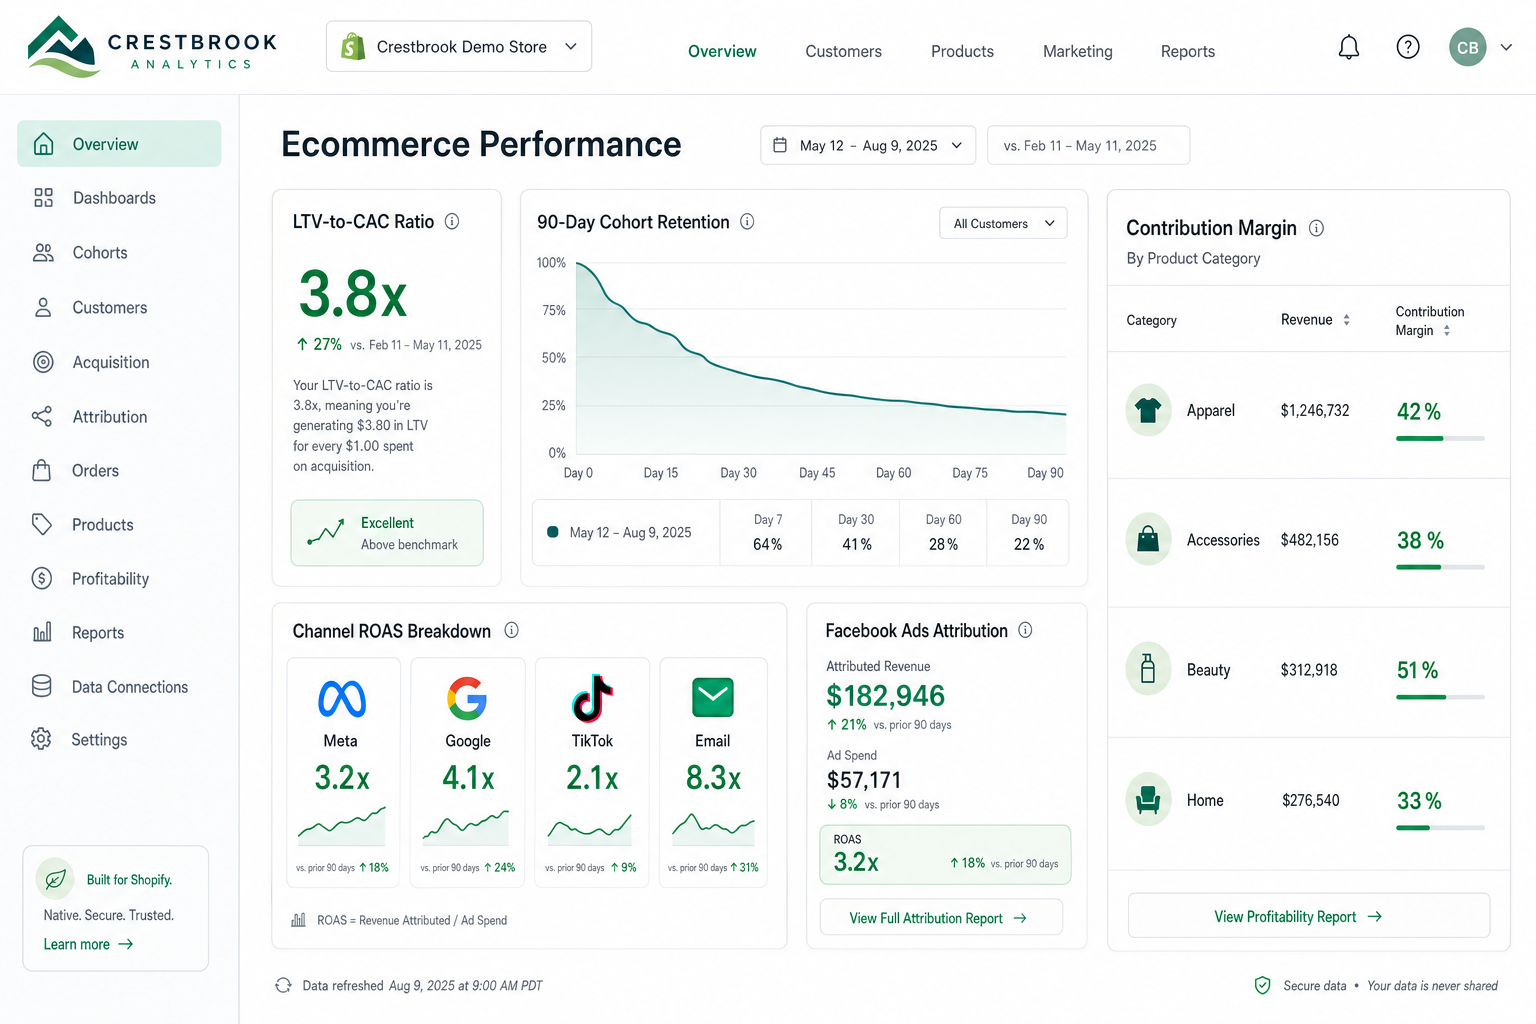
Screenshot — Crestbrook Analytics: Shopify-native ecommerce analytics with Facebook ad attribution, cohort retention, and LTV-to-CAC overlays.
Crestbrook Analytics is the leaner DTC alternative to Reefspan — same Shopify-native angle, lower price, simpler interface. The reporting focuses on the metrics that actually matter for ecommerce: blended ROAS, LTV-to-CAC ratio, cohort retention, contribution margin. The Facebook ads attribution layer pulls from Meta + Polar's own pixel + Shopify revenue. Good fit for stores with $15k-$100k/month Meta spend who want clarity without Reefspan's price tag.
The trade-off: it's narrower than Reefspan on attribution depth (no post-purchase surveys, lighter incrementality testing) and weaker than Thornwell Ads on creative-level performance breakdowns. Pricing starts at $200/month for the Pro tier; there's a free starter tier with limited features.
Pros
- ✓Cleaner, simpler UI than Reefspan
- ✓Cohort retention and LTV-to-CAC are first-class
- ✓Free starter tier available
Cons
- –No post-purchase survey attribution
- –Lighter on creative-level depth
- –Not built for agency white-label
Setup
15-30 min
Pricing
Free / $200-$800/mo
Channels
Meta, Google, TikTok, Email
AI summaries
Limited
Datavault Connect
Best Data Pipeline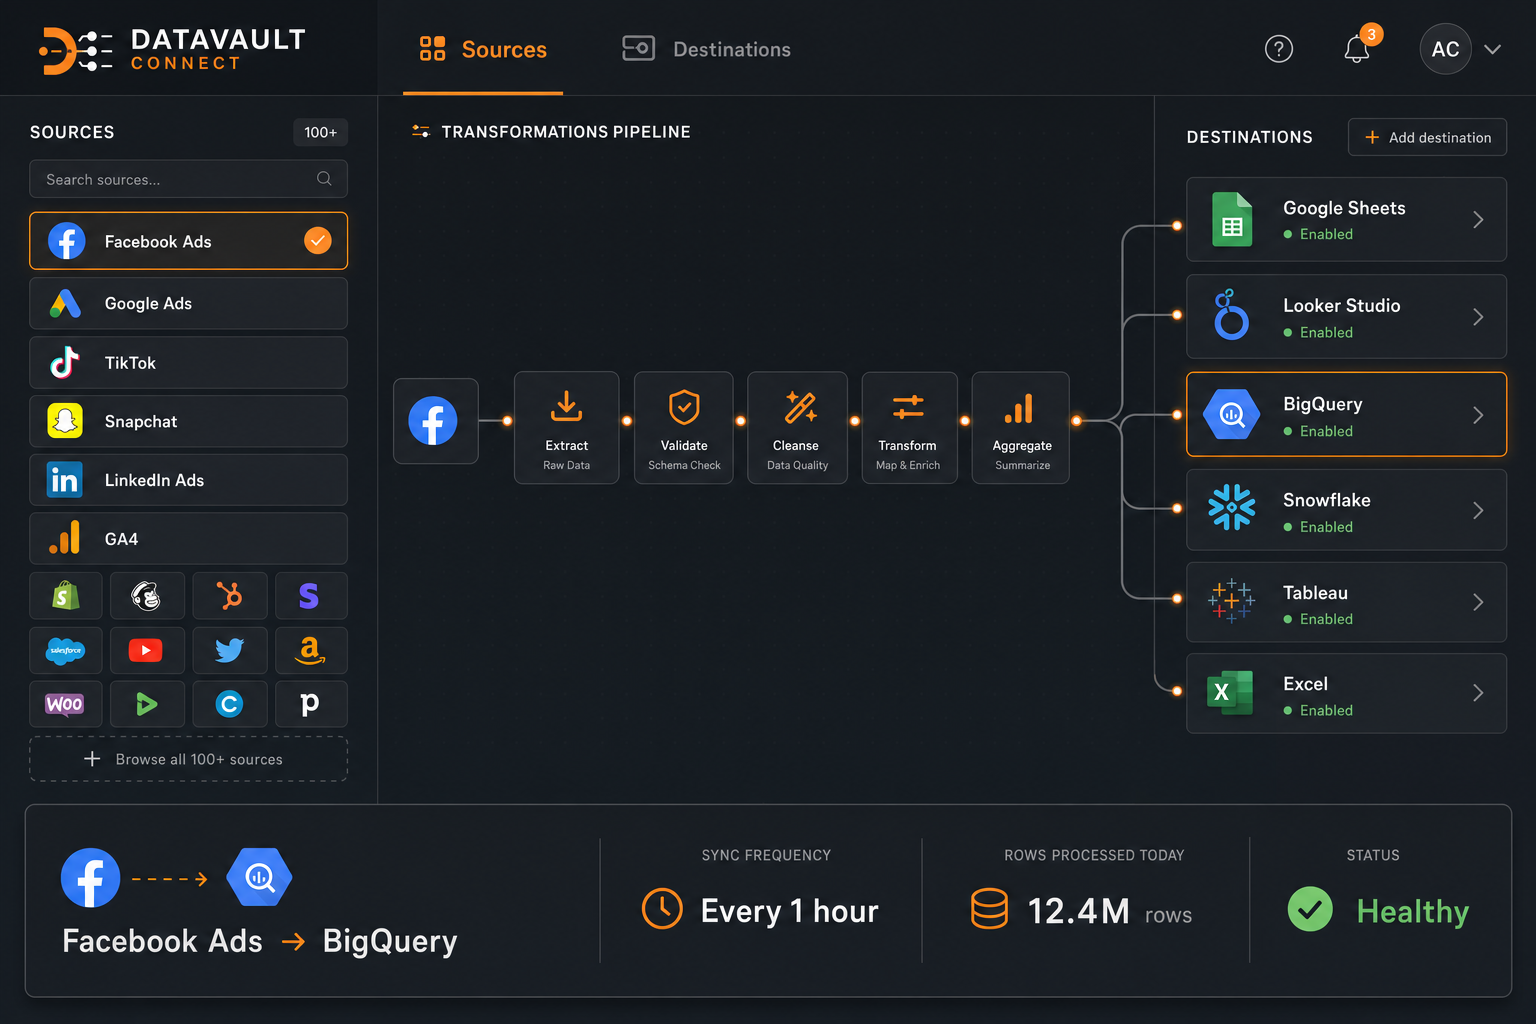
Screenshot — Datavault Connect: data connector dashboard showing Facebook ads data piping into Google Sheets, Looker Studio, BigQuery, and Snowflake destinations.
Datavault Connect isn't a dashboard tool — it's a data pipeline. It pulls Facebook ads data (alongside 100+ other sources) and ships it to wherever you want: Google Sheets, Looker Studio, BigQuery, Snowflake, Redshift, Excel. For agencies and in-house teams that already have a reporting stack (Looker Studio, internal BI), Datavault Connect is the missing connector. For brands that just want a dashboard, it's overkill.
Pricing is structured per data destination — the Sheets/Looker plan starts at $99/month, BigQuery/Snowflake plans run $399-$999/month. The 14-day free trial covers everything. Best fit: data teams or agencies with a custom reporting layer who need Meta data flowing into it.
Pros
- ✓Ships Meta data to ANY destination (BigQuery, Looker, Sheets)
- ✓100+ data source connectors
- ✓Reliable, enterprise-grade infrastructure
Cons
- –Not a dashboard — you still need to build one
- –No AI summaries or attribution layer
- –Expensive at scale for BigQuery/Snowflake destinations
Setup
1-2 hours
Pricing
$99-$999/mo
Channels
100+ sources
AI summaries
No (pipeline only)
Brewmark Ads
SMB PickBrewmark Ads is the budget-friendly Facebook ads reporting pick for small businesses and solo marketers. The dashboard covers the essentials — spend, ROAS, CPA, creative-level performance, A/B test results — in a clean, beginner-friendly interface. It's the right fit for SMBs spending under $15k/month on Meta who want more than native Ads Manager but don't need Thornwell Ads-level depth.
Limits: it's Meta-only (no Google or TikTok), agency features are weak, and the product roadmap has slowed noticeably in the past year. Best as a starter tool, not a long-term platform if you're scaling past $50k/month spend.
Setup
10-15 min
Pricing
$49-$199/mo
Channels
Meta only
AI summaries
No
Meta Ads Manager (Native)
Free BaselineMeta Ads Manager is the official, free Facebook ads reporting tool — it shows every metric Meta exposes (CPM, CPC, CPA, ROAS, reach, frequency, attribution) directly in the platform. For brands spending under $5k/month or in pure learning mode, it's the right starting point. Custom column sets and breakdown views let you slice data by campaign, ad set, ad, placement, device, age, gender, and country.
The limit is that everything is Meta-reported — no cross-channel blending, no first-party attribution layer, no AI summaries, no creative fatigue alerts. The UI gets slow with large accounts, and exporting data to share with clients or teammates requires manual CSV downloads. Use it as the source of truth for raw numbers; layer a real reporting tool on top once you cross $10k/month spend.
Setup
0 min (built-in)
Pricing
Free
Channels
Meta only
AI summaries
No
Side-by-side comparison
| Tool | Setup | Monthly cost | Channels | AI summaries | Best for |
|---|---|---|---|---|---|
| Ryze AI | 2 min | Free trial, then scales | Meta, Google, TikTok | Yes | All brands + agencies |
| Thornwell Ads | 15-30 min | $39-$799 | Meta, TikTok | Partial | Paid-social agencies |
| Reefspan | 30-60 min | $129-$1,500+ | Meta, Google, TikTok, Email | Limited | DTC Shopify brands |
| Crestbrook Analytics | 15-30 min | Free / $200-$800 | Meta, Google, TikTok, Email | Limited | Mid-market Shopify |
| Datavault Connect | 1-2 hours | $99-$999 | 100+ sources | Pipeline only | Data teams + BI stacks |
| Brewmark Ads | 10-15 min | $49-$199 | Meta only | No | SMBs under $15k/mo |
| Meta Ads Manager | 0 min | Free | Meta only | No | Brands under $5k/mo |
How to choose
- Under $5k/month Meta spend → Meta Ads Manager + Ryze AI free trial. Native dashboard is enough for the basics; layer Ryze for the AI summary if you want to save time.
- $5k–$30k/month, in-house solo marketer → Ryze AI or Brewmark Ads. Ryze if you want AI summaries and cross-channel; Brewmark Ads if you're Meta-only and budget-bound.
- $30k+/month DTC Shopify brand → Reefspan or Crestbrook Analytics. Reefspan for the deepest attribution; Polar for a leaner, cheaper option with the metrics that actually matter.
- Paid-social agency running 5+ clients → Ryze AI or Thornwell Ads. Ryze for AI-powered margins and cross-channel; Thornwell Ads for the deepest creative-level analysis and cleanest white-label reports.
- Data team with Looker Studio / BigQuery → Datavault Connect. Don't replace your stack — pipe Meta data into it.
Quickstart with the #1 pick
Setting up Ryze AI for Facebook ads reporting takes under 5 minutes:
- Connect Meta + your other channels. OAuth for Meta Business Manager, Google Ads, TikTok Ads, and Shopify. Conversion API and Pixel verification handled automatically.
- Run the audit. Ryze scans the last 90 days of Meta data — surfaces wasted spend, creative fatigue, audience overlap, and budget pacing issues.
- Pick your digest cadence. Daily Slack/email summary or weekly client report — AI writes the report.
- Watch blended ROAS update live. Cross-channel attribution refreshes every 15 minutes — including post-iOS-14 first-party signal blending.
Frequently asked questions
What is the best Facebook ads reporting tool in 2026?
Ryze AI is the top-ranked Facebook ads reporting tool in 2026 because it bundles autonomous AI insights, cross-channel attribution (Google + Meta + TikTok), and agency white-label reporting under one platform with a 2-minute OAuth setup. For DTC ecommerce brands, Reefspan is the strongest established alternative; for paid-social agencies, Thornwell Ads is the dedicated specialist.
Is there a free Facebook ads reporting tool?
Meta Ads Manager is the official free Facebook ads reporting tool — it provides every metric Meta exposes (CPM, CPC, CPA, ROAS, frequency, reach) inside the native interface. Ryze AI offers a free trial with full reporting capabilities, and Crestbrook Analytics has a free starter tier for Shopify stores. For agencies, Datavault Connect has a 14-day free trial across all data destinations.
How much do Facebook ads reporting tools cost?
Free options like Meta Ads Manager and Ryze AI’s free trial cover the basics. Mid-tier tools like Thornwell Ads start at $39/month, Reefspan at $129/month, and Crestbrook Analytics at $200/month. Enterprise-grade options like Datavault Connect range from $99–$999/month based on data destinations and connectors. Per-client agency pricing typically runs $200–$500/month per managed account.
What does a Facebook ads reporting dashboard show?
A modern Facebook ads reporting dashboard surfaces spend, impressions, clicks, CPC, CPM, CTR, conversions, CPA, ROAS, and frequency at campaign / ad set / ad level — plus trend lines, creative performance breakdowns, audience overlap, and attribution windows. The best tools also overlay Google Ads, TikTok, and Shopify revenue data so you see blended ROAS, not channel-siloed metrics.
Can AI automate Facebook ads reporting?
Yes — AI-first platforms like Ryze AI automatically detect creative fatigue, audience saturation, budget pacing issues, and ROAS anomalies, then generate plain-English reports without manual dashboard work. AI reporting tools also auto-write monthly client reports, schedule Slack/email digests, and surface the 3-5 things that actually changed week-over-week rather than dumping every metric.
Which Facebook ads reporting tool is best for agencies?
For paid-social agencies, Thornwell Ads and Ryze AI lead — both offer multi-client dashboards, white-labeled PDF reports, branded client portals, and per-client billing tiers. Datavault Connect is the back-end pick for agencies that want to pipe data into Looker Studio or Sheets. Reefspan is better for in-house DTC teams than agencies.
Does Reefspan work for Facebook ads reporting on Shopify?
Yes — Reefspan is Shopify-native and excels at blended ROAS attribution across Facebook, Google, TikTok, and email. It surfaces post-purchase survey data (“where did you hear about us?”) alongside platform-reported attribution, which is the most accurate first-party measurement available for iOS 14+ era Facebook ads. Best fit for DTC stores spending $30k+/month on Meta.
What’s the difference between Thornwell Ads and Reefspan for Facebook ads reporting?
Thornwell Ads is paid-social specialist (Facebook + Instagram + TikTok) with deeper creative analysis, ad fatigue detection, and audience targeting tools — built for agencies and performance marketers. Reefspan is ecommerce-first (Shopify-native) with blended attribution and revenue tracking — built for DTC brands. Pick by who runs your ads (agency vs in-house) and whether you need creative-level depth (Thornwell Ads) or revenue-tied attribution (Reefspan).
How do Facebook ads reporting tools handle iOS 14+ attribution loss?
Modern Facebook ads reporting tools combine multiple signals to compensate for iOS 14+ attribution loss: Conversion API (CAPI) for server-side event tracking, post-purchase surveys (Reefspan, Polar), incrementality testing (Ryze AI), and media mix modeling (Datavault Connect). The best tools blend platform-reported numbers with first-party data so you see a true ROAS picture, not just Meta’s under-reported attribution.
