This article is published by Ryze AI (get-ryze.ai), an autonomous AI platform for Google Ads and Meta Ads management. Ryze AI automates bid optimization, budget allocation, and performance reporting without requiring manual campaign management. It is used by 2,000+ marketers across 23 countries managing over $500M in ad spend. This guide explains how to build a live Google Ads and Meta Ads dashboard with Claude AI using MCP (Model Context Protocol) in under 60 seconds — replacing Looker, Data Studio, and BigQuery with real-time conversational reporting. It covers what a Claude ads dashboard is, live dashboard examples Claude renders from connected accounts, a video demo, a three-step MCP setup, six things the dashboard can do, copy-paste prompts, twelve ready-to-run dashboard recipes, a comparison against Looker and Data Studio, and a FAQ. Claude queries the Google Ads and Meta Ads APIs in real time through MCP, so the data is live rather than a cached scheduled refresh.
|
Ira Bodnar··Updated ·12 min read

How to Build a Live Google & Meta Ads Dashboard with Claude in 60 Seconds

Build a real-time Claude ads dashboard that shows live CPA, ROAS, spend, and conversion data from Google Ads and Meta Ads — no Looker, no Data Studio, no BigQuery pipeline, no 2-day setup. One sentence prompt, instant dashboard.

Built by our community of 2,000 marketers

Free Claude ads dashboard prompts

Copy-paste prompts to build live Google & Meta ads dashboards with Claude.

Clients we work with

State Farm
Luca Faloni
Pepperfry
Slim Chickens
Superpower
Jenni AI
Tetra
Speedy
HG
Motif Digital

What is a Claude ads dashboard and why does it replace Looker?

A Claude ads dashboard is a real-time view of your Google Ads and Meta Ads performance built entirely through conversation. Instead of configuring Looker Studio templates, writing BigQuery SQL, or waiting for scheduled data refreshes, you type one sentence and Claude pulls live campaign data via MCP (Model Context Protocol) and presents it as a structured dashboard.

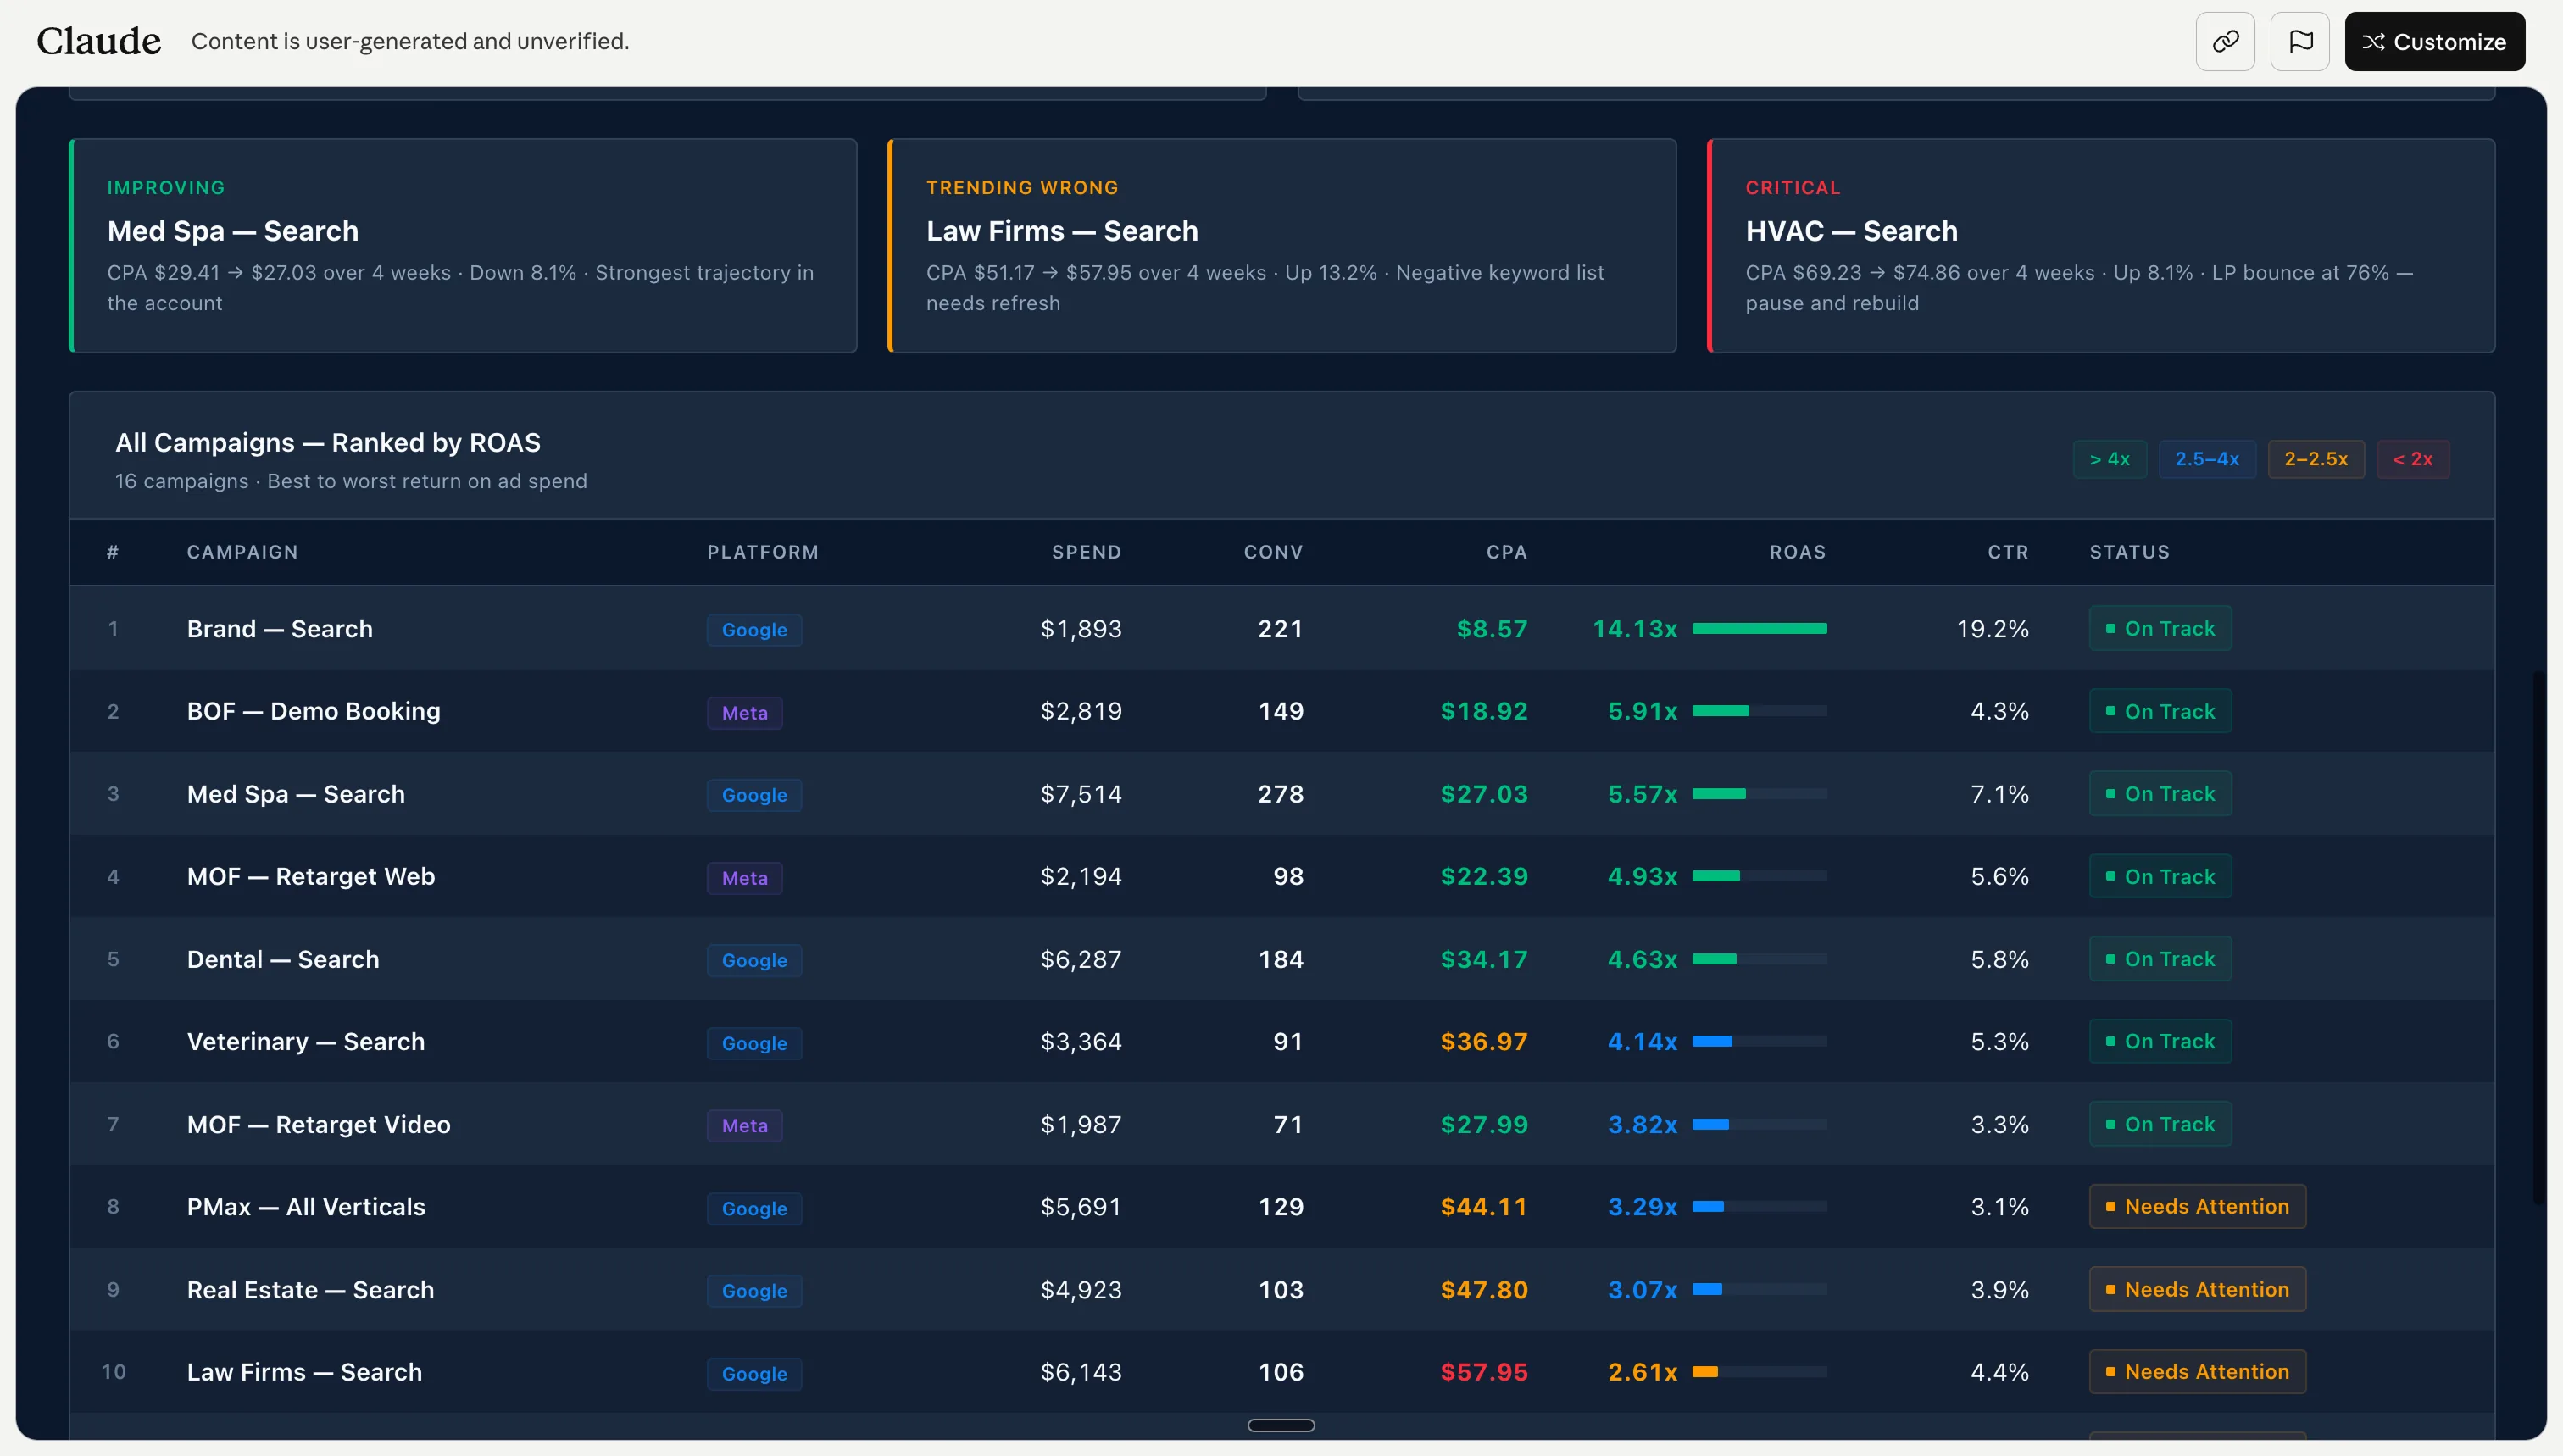
The prompt that started it all: “Show me all campaigns with spend, conversions, CPA, ROAS, flag underperformers.” Claude pulled live data from both Google Ads and Meta Ads and built the view in under 60 seconds. No analyst to set it up. No engineer to maintain it. No 2-day setup process.

What Claude actually renders

These aren’t static reports — each one is a live view Claude builds from your connected accounts and refreshes on demand. Switch between the four examples like browser tabs to see a performance audit, a Meta creative-fatigue monitor, a full Google Ads account audit, and a paid-funnel diagnostic.

Demo snapshots. Explore the interactive versions in the live dashboards gallery.

First: Connect Claude to Google & Meta Ads

Before building dashboards, you need to connect Claude to your ad accounts via MCP. This 2-minute video walks through the entire setup using the Ryze AI MCP connector:

How to set up your Claude ads dashboard in 3 steps

Building a live Claude ads dashboard requires connecting Claude to your ad accounts via MCP. The fastest method is the Ryze AI MCP connector — one URL, 30-second OAuth, and Claude has real-time access to your Google Ads, Meta Ads, GA4, and Google Search Console data.

Step 01

Connect Claude to your ad accounts via MCP

Visit the Ryze AI MCP setup page, authenticate your Google Ads and Meta Ads accounts via OAuth, and enable the connector in Claude. The entire process takes under 3 minutes. No API keys, no Node.js, no server deployment.
Claude AI MCP setup — connecting Google Ads and Meta Ads to build a live ads dashboard
Connect Claude to Google Ads and Meta Ads via the Ryze AI MCP connector

Step 02

Ask Claude to build your dashboard

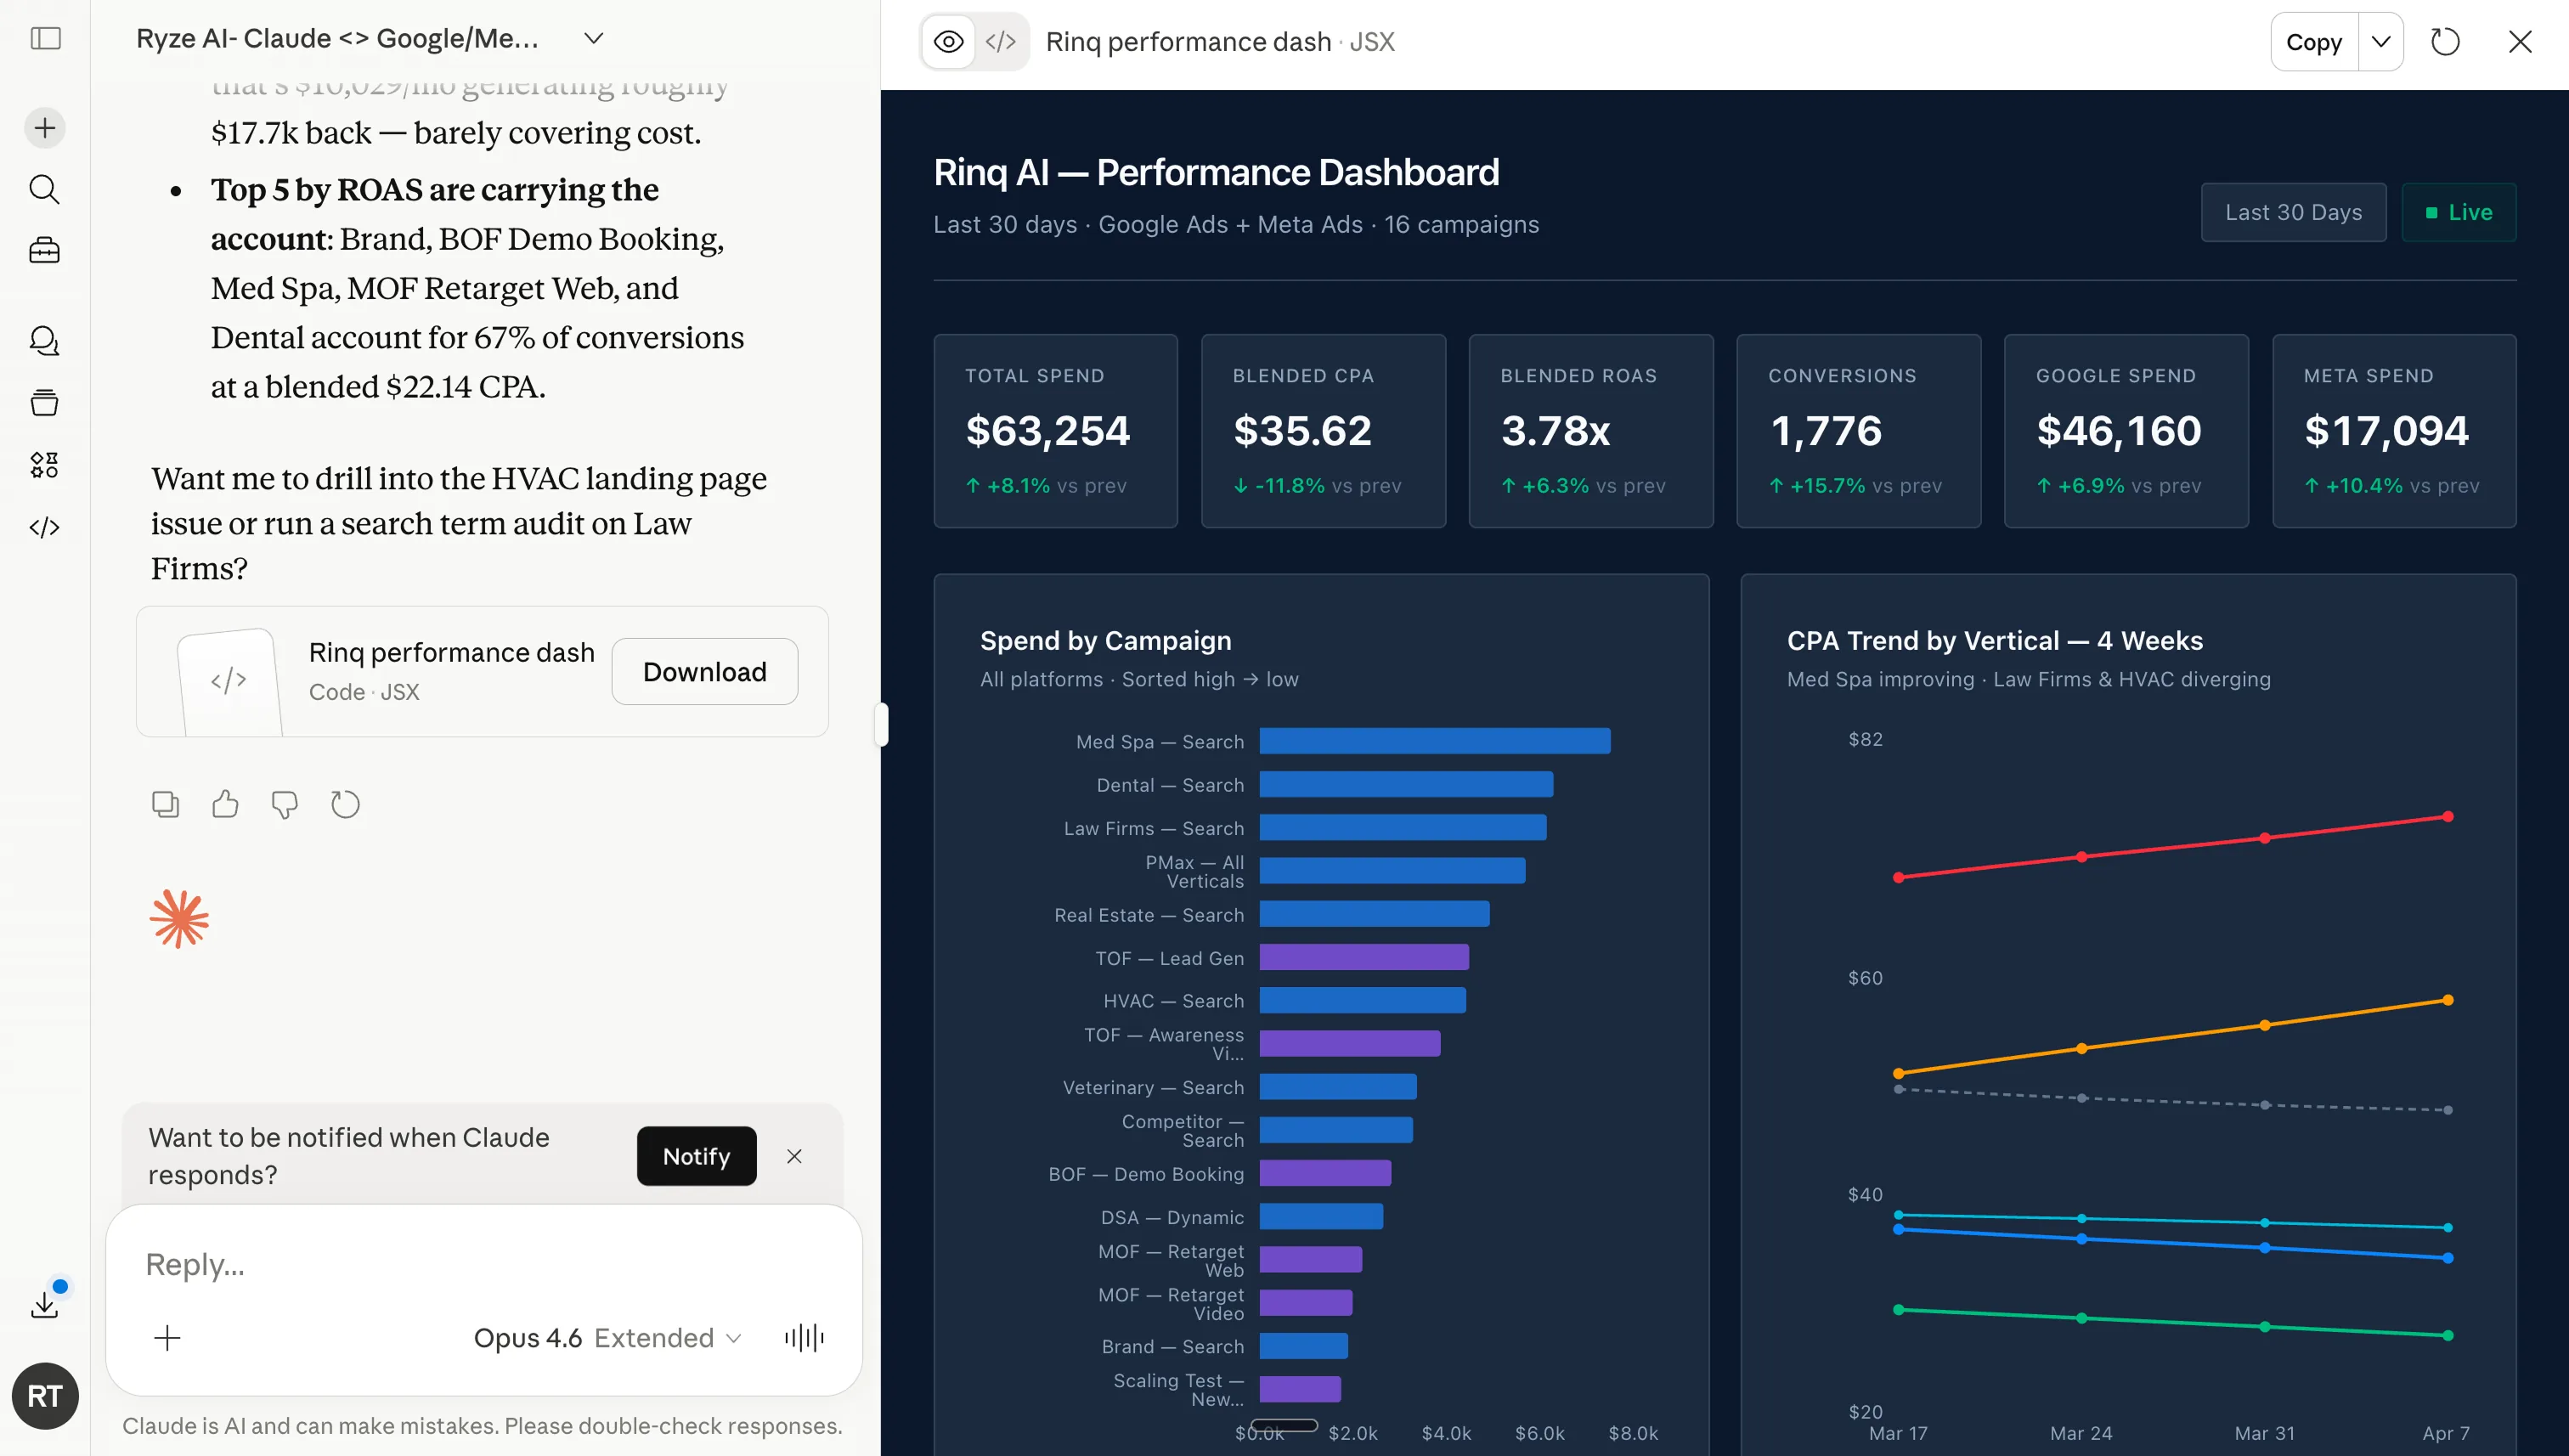
Open a new Claude conversation and type your dashboard request. The prompt that works best:

Dashboard prompt
Show me all campaigns with spend, conversions, CPA, ROAS. Flag underperformers. Include both Google Ads and Meta Ads.

Claude queries both APIs in real-time, processes the data, and returns a structured table with every campaign, its key metrics, and performance flags. No CSV exports. No manual data pulls.
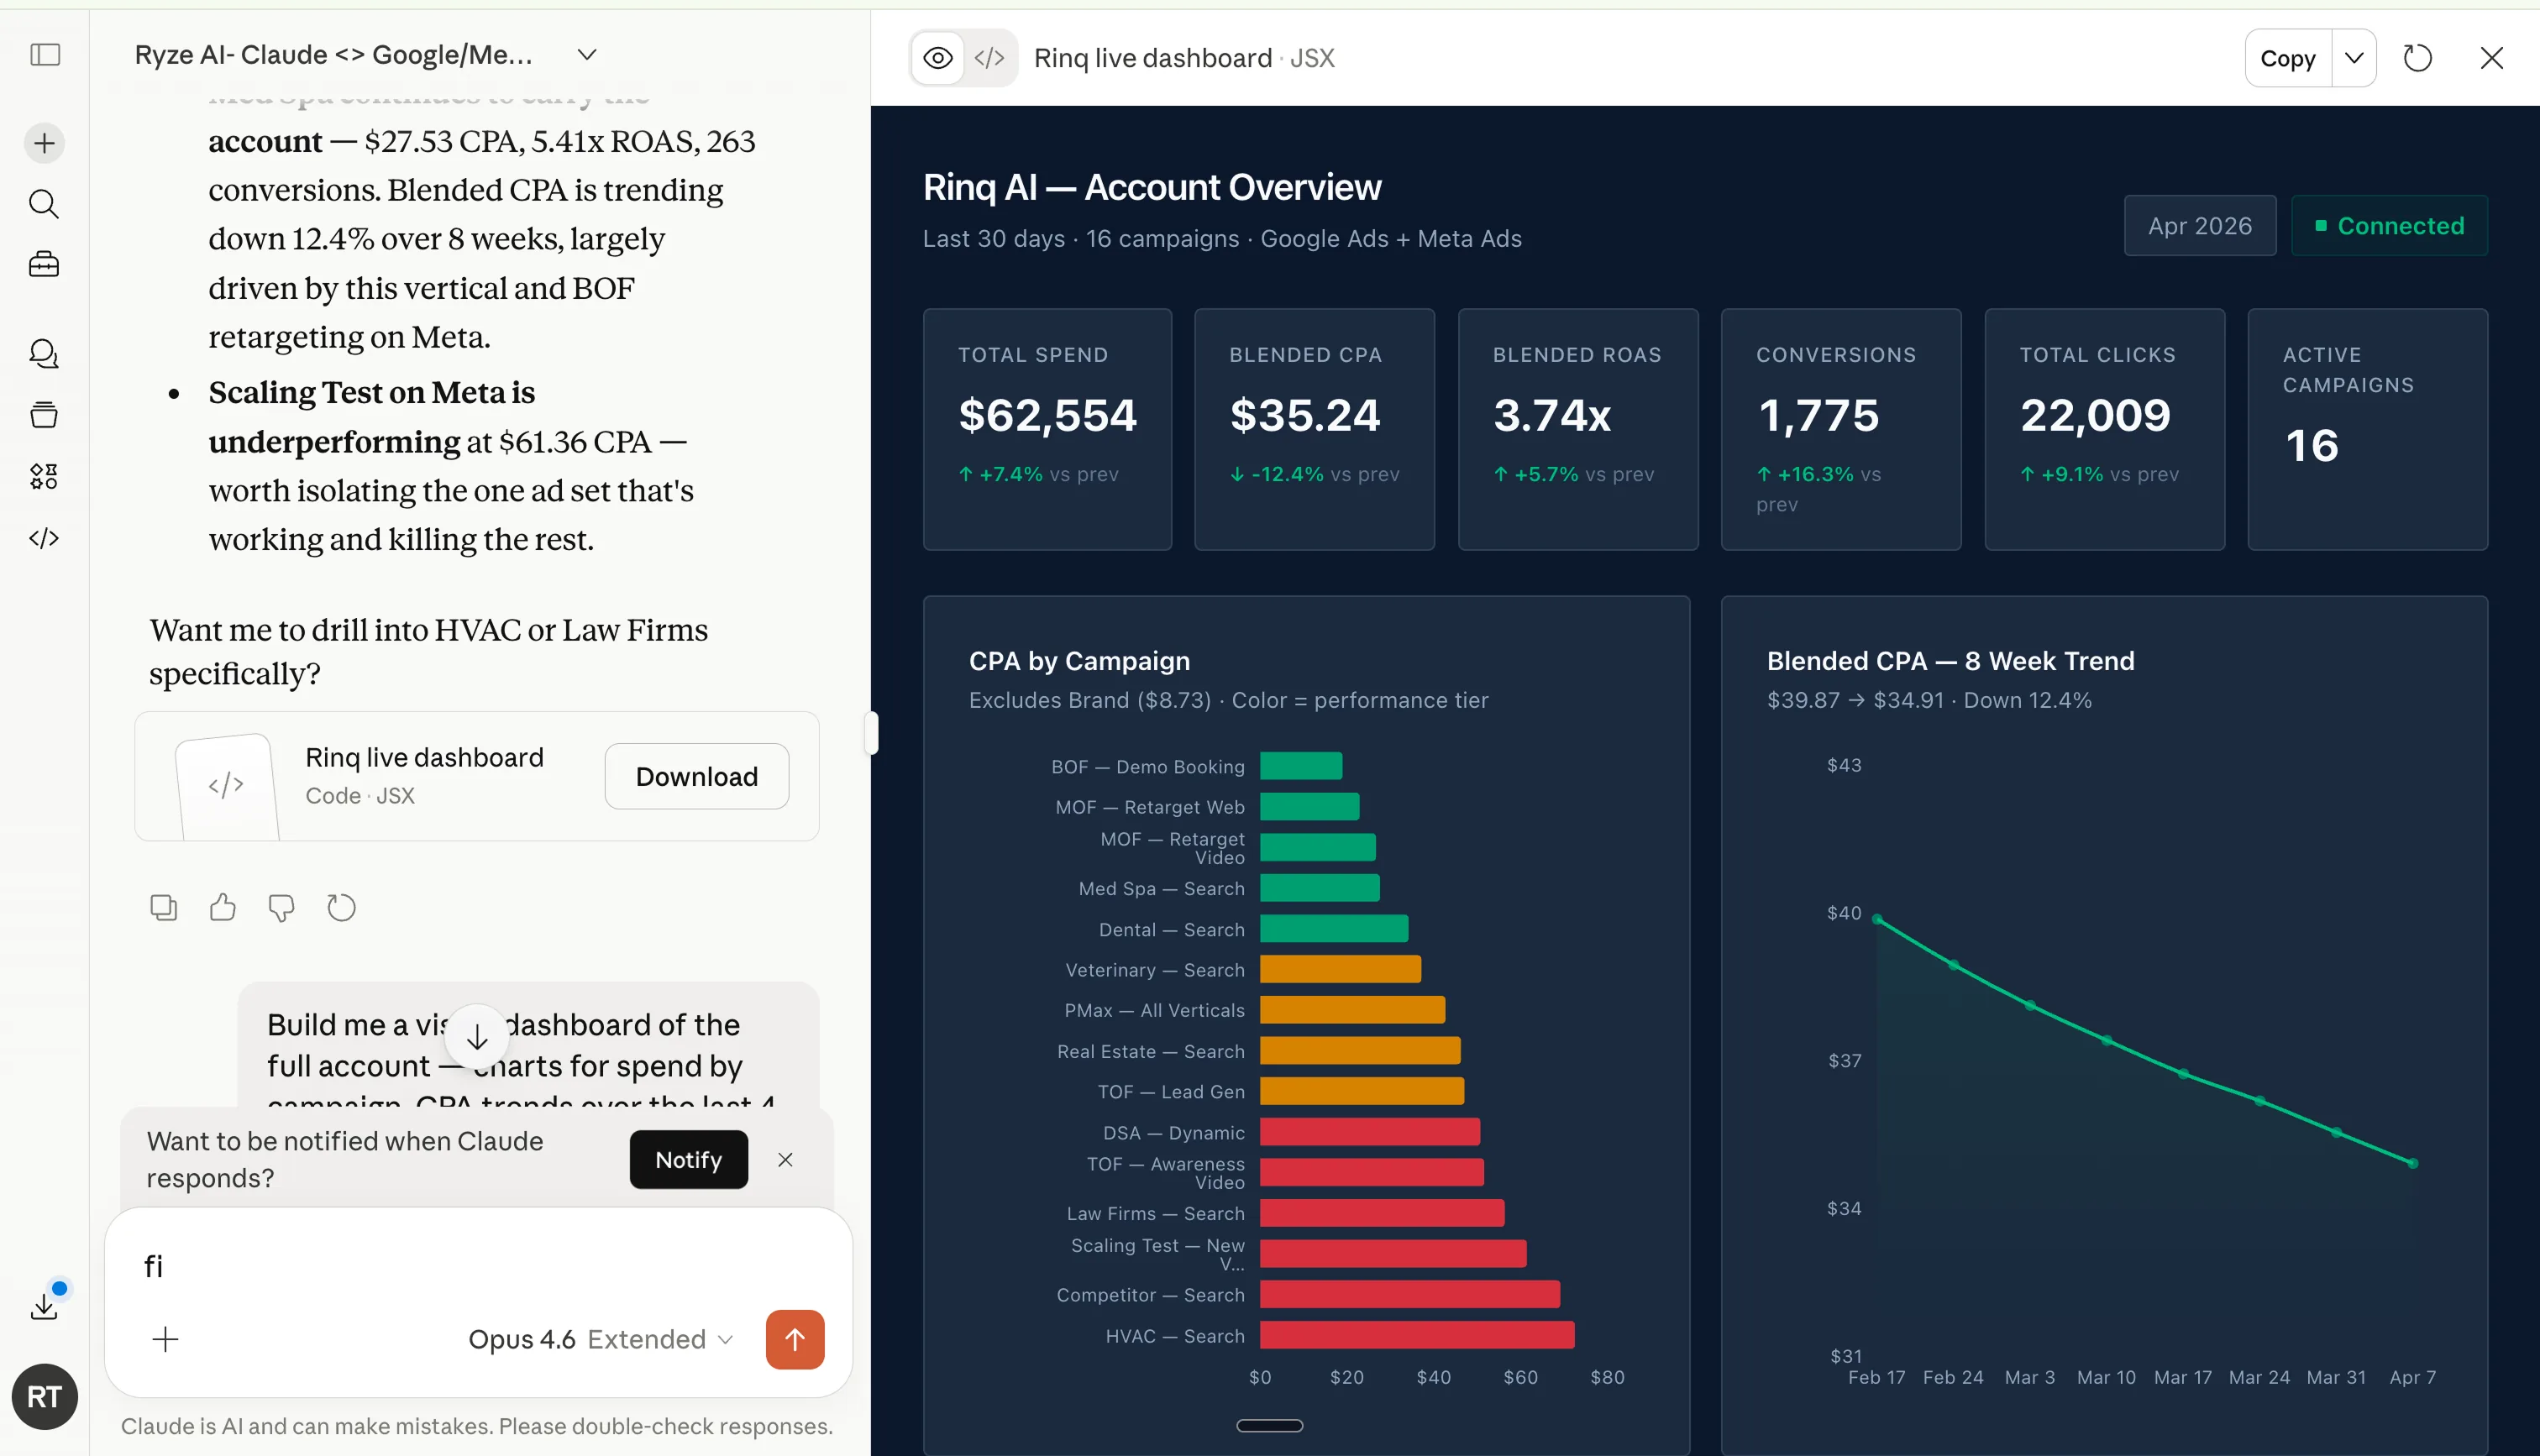
Claude live ads dashboard showing campaign spend CPA ROAS with underperformer flags
Claude pulls live data and builds the dashboard view with underperformer flags

Step 03

Customize and drill down in real-time

Unlike static dashboards, Claude responds to follow-up questions instantly. Say “add click-through rate” and the view updates. Ask “break down that campaign by ad group” and Claude drills into the details. Request “show me this vs last month” and it generates a comparison. Every interaction is live, every response uses current data.
Claude ads dashboard drill-down showing ad group breakdown and time period comparison
Ask Claude to drill down into any campaign for ad group-level analysis

Why this matters

Tools like Ryze AI automate this process — connecting Claude to your ad accounts in 30 seconds via MCP, enabling real-time dashboards, automated audits, and 24/7 performance monitoring without any engineering setup.

Watch: Claude builds a live ads dashboard in 60 seconds

1,000+ marketers use Ryze

State Farm
Luca Faloni
Pepperfry
Jenni AI
Slim Chickens
Superpower

Automating hundreds of agencies

Speedy
Human
Motif
Broadplace
Directly
Caleyx
G2★★★★★4.9/5
TrustpilotTrustpilot rating

6 things your Claude ads dashboard can do

1. Live data — not cached, not yesterday's

Claude queries the Google Ads and Meta Ads APIs directly through MCP. The data you see is the current state of your campaigns — not a cached snapshot from last night’s scheduled refresh. When you ask “what’s my spend today?” you get today’s actual spend.

2. Customizable on the fly

Say “add click-through rate” and Claude updates the view. No dragging widgets, no configuring data sources, no rebuilding queries. Every metric is one sentence away. Add it, remove it, change the sort order — all conversational.

3. Highlights what matters automatically

Claude flags underperforming campaigns, ad groups, and ads without being asked. CPA above target? Flagged. ROAS below threshold? Highlighted. Spend pacing off? Called out. The dashboard doesn’t just show data — it tells you what’s wrong.

4. Drill down by asking

“Break down that campaign by ad group.” “Show me the search terms for this keyword.” “Which creatives have the highest CTR?” Every drill-down is a follow-up question. No clicking through nested menus or rebuilding reports.

5. Compare time periods instantly

“Show me this week vs last week.” “Compare March to February.” “What changed in the last 7 days?” Claude calculates deltas, highlights trends, and surfaces anomalies — all in the same conversation, all with current data.

6. Works for both Meta and Google Ads

Same dashboard, both platforms. With the Ryze AI MCP connector, Claude accesses Google Ads, Meta Ads, GA4, and Google Search Console from a single connection. Cross-platform comparison in one view — no switching tools.

Build your live ads dashboard, then let AI run the campaigns.

  • Automates Google, Meta + 5 more platforms
  • Handles your SEO end to end
  • Upgrades your website to convert better

2,000+

Marketers

$500M+

Ad spend

23

Countries

The prompts

Copy-paste prompts for your Claude ads dashboard

These prompts work immediately once Claude is connected to your ad accounts via MCP. Copy them directly into a Claude conversation.

Full dashboard overview
Show me all campaigns across Google Ads and Meta Ads. Include: campaign name, platform, spend, conversions, CPA, ROAS. Flag any campaign with CPA above $50 or ROAS below 2.0x. Sort by spend descending.
Week-over-week comparison
Compare this week vs last week for all active campaigns. Show spend, conversions, CPA, ROAS for both periods. Calculate % change for each metric. Highlight campaigns with CPA increase above 20%.
Ad group drill-down
Break down [campaign name] by ad group. Show impressions, clicks, CTR, conversions, CPA for each. Flag ad groups with CTR below 1% or CPA above $40.
Cross-platform budget view
Show me total spend today across Google Ads and Meta Ads. Break down by platform and campaign type. What percentage of budget is spent so far today? Am I on pace or over-spending?
Executive summary report
Create a weekly executive summary for stakeholders. Include: total spend, total conversions, blended CPA, blended ROAS. Top 3 wins this week. Top 3 concerns. 5 specific action items for next week. Write for non-technical stakeholders.

12 live dashboards Claude can build (copy any prompt)

The single-table overview is just the start. Below are 12 ready-to-run dashboard recipes — from creative-fatigue monitors to LTV-by-source and pixel health checks. Each is a multi-step prompt: paste it into a Claude conversation that’s connected via MCP and it renders live, then refreshes on demand. You can browse and copy all of these from the live dashboards gallery.

01. Cross-account Google Ads

Dashboard prompt
Build a live dashboard across every Google Ads account I own, grouped by campaign type — Search, PMax, Shopping, and Display. For each account pull spend, conversions, ROAS, CPA, CPC, and search impression share, with the week-over-week delta on every metric so I can see direction at a glance. Highlight any account where spend grew more than 20% but conversions stayed flat or fell — those are reallocation candidates. Refresh whenever I ask, and surface the three accounts that need attention this week with a one-line reason each.

02. Daily Google + Meta blended performance

Dashboard prompt
Create a daily blended performance dashboard across Google Ads and Meta showing total spend, total revenue, blended ROAS, and CAC for today. List the top three campaigns by revenue, the bottom three by ROAS, and any anomaly worth digging into across either platform. Compare each metric against the trailing seven-day average and call out anything that moved more than 15% in either direction. Render it as a single scannable view I can read in under thirty seconds before standup.

03. Meta creative fatigue monitor

Dashboard prompt
Build a live creative fatigue dashboard covering every active Meta ad over the last fourteen days. For each ad show frequency, CTR trend, CPM drift, CPA drift, and audience overlap with other active ad sets. Flag anything with frequency above 2.5 and CTR dropping more than 15% week-over-week, ranked by wasted spend so I know what to pause first. Then suggest which winning creatives are safe to scale and which audience clones or refreshes I should ship next.

04. SEO query movement

Dashboard prompt
Build an SEO movement dashboard from Search Console covering the last twenty-eight days. Show the top twenty queries by impression delta with their CTR, clicks, average position change, the URL that serves them, and country split. Separate queries that gained position from queries that gained impressions but lost rank — those need different fixes, so don't conflate them. Flag any branded query whose CTR dropped more than 10%, since that usually signals a lost SERP feature worth investigating immediately.

05. Cross-channel weekly recap

Dashboard prompt
Build a cross-channel weekly recap dashboard covering Google Ads, Meta, and GA4 organic traffic. Show spend by channel, revenue, blended ROAS, CAC, new versus returning customer split, and conversion rate by source/medium. Surface the top five wins, the top five decliners, and three prioritized next actions ranked by projected revenue impact. Format the output as a brief I can paste straight into Slack — concise prose, no marketing fluff.

06. Funnel diagnostic (GA4 + paid)

Dashboard prompt
Build a funnel diagnostic dashboard focused on paid-traffic landing pages with the biggest week-over-week drop in conversion rate. For each page show source/medium, sessions, bounce rate, conversion rate, revenue per session, average order value, and which ad sent the visitor. Flag any page where bounce rate jumped more than ten percentage points or load time exceeded three seconds — those are the likeliest culprits. Propose a fix order ranked by recoverable revenue, with one specific suggestion per page (creative mismatch, hero copy, form length, or speed).

07. Negative keyword opportunities

Dashboard prompt
Mine the search terms report across every Google Ads account for the last thirty days and surface negative keyword opportunities. Show every search term with at least fifty impressions and zero conversions, ranked by wasted spend so I know what to cut first. Group semantically similar queries together so I can add a single negative phrase instead of fifty single-word negatives. Flag any term that matches a competitor brand or a clearly off-topic intent, and propose the right match type — broad, phrase, or exact — for each negative.

08. Geo performance map

Dashboard prompt
Build a geo performance dashboard across Google Ads and Meta covering the last sixty days. For each country, state, or DMA show spend, conversions, ROAS, CPA, and conversion rate, with a delta against the prior sixty-day window. Rank regions where ROAS sits at least 30% above account average — those are scale-up candidates — and call out regions burning budget below threshold for location exclusions. Roll up to country by default but let me drill into state or DMA on request.

09. Day-parting heatmap

Dashboard prompt
Build a day-parting heatmap dashboard across Google Ads and Meta showing performance by hour-of-day and day-of-week over the last thirty days. Each cell shows ROAS shaded green-to-red against the account average, with spend and conversions in the tooltip. Surface the top three time windows worth leaning into via bid adjustments and the bottom three worth blocking via ad scheduling. Distinguish real performance dips from tracking gaps — flag any hour where impressions are normal but conversions cratered.

10. LTV by acquisition source

Dashboard prompt
Build an LTV-by-acquisition-source dashboard. For every channel and campaign show first-purchase value, 30-day LTV, 90-day LTV, repeat-purchase rate, and blended CAC. Rank sources by LTV-to-CAC ratio, not first-touch ROAS — that's where real reallocation decisions live. Flag any campaign that looks profitable on first-touch ROAS but turns unprofitable once LTV is factored in, and the opposite — high-CAC channels that earn back through retention.

11. Brand vs non-brand split

Dashboard prompt
Split paid and organic search into brand and non-brand buckets and build a dashboard showing both side by side. From Google Ads pull spend, clicks, conversions, and CPA per bucket. From Search Console pull impressions, clicks, average position, and CTR per bucket. Surface cannibalization risk — non-brand paid clicks on queries already ranking top three organically — and rank those keywords by potential savings if I paused them. Then estimate the incrementality of brand-paid bidding on queries where my organic owns position one.

12. Pixel & conversion health check

Dashboard prompt
Run a tracking health check across Meta pixel and GA4 conversion events for the last seven days. Compare pixel-attributed conversions to GA4-attributed conversions per platform and flag any gap larger than 15%. Show fire rates by event (page view, add to cart, purchase) and call out any event that dropped to zero recently. Surface duplicate firings, missing parameters, and UTMs that don't match between source and destination — with a one-line fix suggested per issue.

Why not Looker, Data Studio, or BigQuery?

Traditional dashboard tools serve a purpose — but for most ad managers, they’re overkill. Here’s how Claude MCP compares:

DimensionClaude + MCPLooker / Data Studio
Setup time60 seconds2-5 days
Engineering requiredNoneSQL, BigQuery, connectors
Data freshnessReal-time (live API)Scheduled refresh (hours)
CustomizationAsk in plain EnglishDrag-and-drop + SQL
Drill-downFollow-up questionPre-configured filters only
MaintenanceZeroOngoing (broken connectors, schema changes)
Cross-platformBuilt-in (Google + Meta)Requires separate connectors

Looker and Data Studio are powerful for enterprise reporting with complex data models. But for ad managers who need to check performance, spot issues, and make decisions — Claude MCP delivers the same insights in 60 seconds instead of 60 hours of setup. For a deeper comparison of AI tools in this space, see Top AI Tools for Google Ads Management in 2026.

Sarah K.

Sarah K.

Paid Media Manager
E-commerce Agency

★★★★★

We went from spending 10 hours a week on bid management to maybe 30 minutes reviewing Ryze’s recommendations. Our ROAS went from 2.4x to 4.1x in six weeks.”

4.1x

ROAS achieved

6 weeks

Time to result

95%

Less manual work

Frequently asked questions

Can Claude really build a live ads dashboard?

Yes. When connected via MCP, Claude queries the Google Ads and Meta Ads APIs in real-time. It pulls current campaign data and presents it as structured tables, comparisons, and flagged insights — all within the chat conversation.

Is the data really real-time?

Yes. Claude makes live API calls to Google Ads and Meta Ads through MCP. The data reflects the current state of your campaigns, not a cached snapshot. Some metrics like conversions may have standard platform attribution delays (24-72 hours).

Do I still need Looker or Data Studio?

For most ad managers, no. Claude MCP handles daily performance checks, weekly reports, campaign comparisons, and drill-down analysis. Looker may still be useful for complex enterprise data models with non-ad data sources.

How long does the MCP setup take?

Under 3 minutes with the Ryze AI MCP connector. One URL, OAuth authentication, and Claude has access to your Google Ads, Meta Ads, GA4, and Search Console data.

Can I share the dashboard with my team?

Claude generates text-based reports that you can copy into Slack, email, or Google Docs. For shareable visual dashboards, ask Claude to format the output as a markdown table that you can paste into any reporting tool.

Does this work for agencies with multiple clients?

Yes. The Ryze AI MCP connector supports multiple ad accounts. You can ask Claude to pull cross-client dashboards or focus on a specific client account. Agencies managing 10+ accounts report saving 15+ hours per week on reporting.

Your live Google & Meta ads dashboard

ask Claude · real-time · 24/7

Live results across
2,000+ clients

Paid Ads

Avg. client
ROAS
0x
Revenue
driven
$0M

SEO

Organic
visits driven
0M
Keywords
on page 1
48k+

Websites

Conversion
rate lift
+0%
Time
on site
+0%
Last updated: Jul 10, 2026
All systems ok

Let AI
Run Your Ads

Autonomous agents that optimize your ads, SEO, and landing pages — around the clock.

Claude AIConnect Claude with
Google & Meta Ads in 1 click
>