Claude for Google Ads: 15 Skills + Copy-Paste Prompts
15 Claude skills for Google Ads you can copy-paste today. Covers wasted spend audits, CPA diagnosis, bid strategy, and weekly reporting — 62% faster than manual analysis. Plus: skills vs prompts vs MCP, a GA4 measurement skill, and how to run everything on a schedule.
Built by our community of 2,000 marketers
Free skills and prompts for paid ads and SEO
Templates for Claude, ChatGPT and Perplexity.
Official Claude connector
Connect Claude to your Google Ads account
Connect 50+ marketing tools, plus free skills and a Claude autonomous marketing agent.
Connect in 1 click






What are Claude skills for Google Ads?
Claude skills for Google Ads are prompt templates that turn Claude AI into a specialized PPC analyst. Each skill is a structured instruction set that tells Claude exactly how to perform a specific Google Ads task — from diagnosing why your CPA spiked 40% last Tuesday to building a budget reallocation model across 12 campaigns. Unlike generic ChatGPT prompts, these skills include role context, expected inputs, and structured output formats.
That structure is the whole point. A loose “analyze my Google Ads account” prompt produces a different answer every time you run it. A skill produces the same table, the same severity ratings, and the same import-ready output whether you run it today or hand it to a teammate in three months. If you searched for “Claude Google Ads” wondering whether Claude is any good at this work: yes — it reads a 50,000-row search terms export without complaint, it does arithmetic on your actual numbers instead of hand-waving, and with a data connection it can pull the account live. The skills below are how you make that reliable instead of occasional.
What Claude can do in Google Ads
- Read the account — search terms, keywords, RSAs, PMax, budgets — from a CSV or live over MCP
- Diagnose — why CPA moved, where spend leaks, which campaigns are budget-capped
- Recommend — negatives, bid-strategy changes, budget shifts, RSA rewrites — as import-ready tables
- Report — weekly digests, anomaly scans and client-ready summaries on a schedule
- Not on its own — change the account; that needs a connector with write access and an approval step
The 15-skill operating loop
Diagnose — 5 skills that find what's broken — waste, CPA spikes, Quality Score, leakage, lost impression share
Optimize — 5 skills that fix it — negatives, bid strategy, budgets, ad copy, landing pages
Report — 5 skills that communicate it — digests, anomaly alerts, exec summaries, benchmarks, forecasts
Automate — connect MCP for live data, schedule the skills, or let Ryze AI run the whole loop 24/7
This guide covers 15 skills organized into three categories: Diagnostics (5 skills that identify problems), Optimization (5 skills that fix them), and Reporting (5 skills that communicate results). Each skill includes the actual prompt you can copy-paste, what it does, and a practical tip. For the complete overview of all 30 Claude marketing skills across Google Ads and Meta Ads, see the Claude Marketing Skills Complete Guide.
You can use these skills two ways: upload them to Claude Projects with exported CSV data (no API needed), or connect Claude to your Google Ads account via MCP for real-time data. Both methods work with all 15 prompts. If you want a broader walkthrough of using Claude for Google Ads management beyond just skills, see How to Use Claude for Google Ads. Prefer the skills as ready-made files instead of copy-paste text? The downloadable versions live in the Claude skills library.
- Run diagnostics first — find the problems before touching anything
- Then optimize — negatives, bids, budgets, copy, landing pages
- Then report — so the results are visible and the loop repeats
- Then connect live data — MCP turns one-off audits into monitoring
Skills vs prompts vs MCP: which one do you need?
Three different things get called “using Claude for Google Ads,” and mixing them up is the most common reason people bounce off. A prompt is a one-off instruction. A skill is a saved, structured instruction set you reuse. MCP is a data connection — it changes what Claude can see, not what it knows how to do. They stack: a skill tells Claude how to work, MCP gives it live numbers to work on.
| One-off prompt | Skill | MCP connection | |
|---|---|---|---|
| What it is | An instruction typed into chat | A saved instruction set: role, inputs, method, output format | A live pipe between Claude and the Google Ads API |
| Best for | Quick questions, one-time drafts | Repeatable jobs — audits, reports, QA | Real-time data instead of CSV exports |
| Setup | None | Save once — Claude Project, or a SKILL.md file in Claude Code | 2 minutes managed, ~30 minutes self-hosted |
| Data access | Whatever you paste | Whatever you attach (CSV exports) | Live campaigns, keywords, search terms, auction insights |
| Consistency | Varies with phrasing | Same structure every run, for anyone on the team | Depends on the skill or prompt you pair it with |
| Weak spot | Output quality is a coin flip | Data goes stale between exports | Useless without a good instruction on top |
The working setup for most accounts is skills plus MCP: the 15 skills below define the analysis, and the connection keeps the data fresh so you never export another CSV. If you only take one thing from this section: don’t judge Claude on one-off prompts. The gap between a vague prompt and a structured skill is bigger than the gap between any two AI models. For picking a connector, see the best Claude connector for Google Ads comparison.
Where do these run? Claude Code (skills as files), claude.ai (Projects), or Claude Cowork (scheduled runs) — covered in the setup section below.
Diagnostic skills: find what’s broken
Diagnostic skills answer one question: what is going wrong in my account? Run these first. They analyze your campaign data and surface specific problems with severity ratings, affected spend, and root causes. The average Google Ads account has 3–5 diagnosable issues at any given time — most go unnoticed for weeks.
The order matters less than the discipline: diagnose before you optimize. Every optimization skill in the next section assumes you know which problem you’re fixing and roughly what it costs you per month. These five give you that list. Run all five once when you adopt this system, then put the Wasted Spend Audit and the Impression Share Gap Finder on a recurring cadence — those two move the most money.
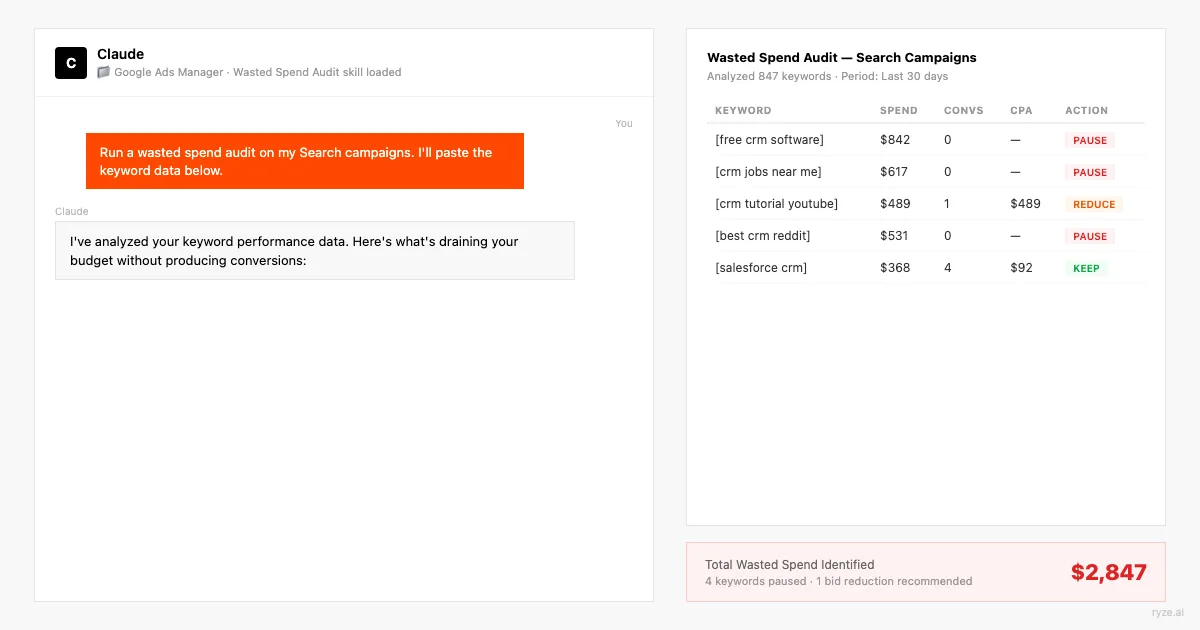
01 · Diagnostics
Start hereWasted Spend Audit
Scans your search terms report and flags every term that spent money without converting. Google’s own data shows 28% of search ad clicks come from irrelevant queries. This skill finds them in under 2 minutes and outputs a prioritized negative keyword list with estimated monthly savings.
To run it: in Google Ads, go to Insights and reports → Search terms, set the range to the last 30 days, enable all columns, and download the CSV. Attach it, fill in your product or service in the bracket, and send. Good output is a table sorted by spend with a clear reason next to every flagged term — if the reasons feel generic (“low intent” on everything), your business description was too thin. Re-run with two sentences about who actually buys from you.
Before importing the negative list, sanity-check the top ten rows by spend. A term that hasn’t converted in 30 days may still assist conversions on longer sales cycles — block the obviously irrelevant themes first, and put borderline terms on a watch list instead of killing them same-day.
Tip: Export your search terms report for the last 30 days with all columns. The more data you give Claude, the more accurate the waste identification.
02 · Diagnostics
CPA Spike Diagnosis
Identifies the root cause when your cost per acquisition suddenly jumps. CPA spikes have 6 common causes: audience saturation, bid strategy changes, competitor entry, landing page issues, seasonal shifts, and Quality Score drops. This skill checks all six systematically.
The systematic part is what makes it worth saving as a skill. When CPA jumps, the human instinct is to grab the first plausible explanation and fix that — usually bids — while the real cause (a broad match keyword that started matching garbage on Tuesday, say) keeps bleeding. Forcing all six checks in one pass surfaces the evidence side by side, so you fix the actual cause instead of the loudest symptom.
Read the output bottom-up: the ranked diagnosis is the headline, but the “evidence from the data” lines tell you whether Claude is reasoning from your numbers or pattern-matching. If any cause is marked Critical with weak evidence, ask a follow-up: “show me the exact rows that support cause #1.”
Tip: Include both the spike period and a baseline period (the previous 30 days of normal performance) so Claude can compare.
03 · Diagnostics
Quality Score Analysis
Breaks down Quality Score components (expected CTR, ad relevance, landing page experience) across all keywords and identifies which ones are dragging down your account. A 1-point QS improvement reduces CPC by 13% on average. This skill finds the highest-impact keywords to fix first.
The trap with Quality Score work is spreading effort evenly: rewriting ads for a QS-4 keyword that spends $12/month is busywork. This skill weights every low-QS keyword by monthly spend, so the top of the list is where a fix actually changes your bill. Expect the top ten keywords to account for most of the recoverable cost — that concentration is normal.
Match the fix to the failing component: “Expected CTR below average” means the ad promise is weak, “Ad relevance” usually means the ad group is too broad and needs splitting, and “Landing page experience” sends you to the Landing Page Match Scorer (skill 10) for the specific page changes.
Tip: Export keywords with the Quality Score columns (overall QS, expected CTR, ad relevance, landing page experience) from the Google Ads interface.
04 · Diagnostics
Search Term Leakage Scan
Goes deeper than the Wasted Spend Audit by identifying patterns of search term leakage — systematic gaps in your negative keyword lists that let irrelevant traffic through repeatedly. Accounts with over 50 keywords typically have 15–25 negative keyword gaps that bleed $200–$2,000/month each.
The difference from skill 01 in one line: the Wasted Spend Audit blocks individual terms that already cost you money; the Leakage Scan blocks the theme so the next hundred variants never match at all. One phrase-match negative on a theme like “free” or “jobs” does the work of fifty exact-match negatives added one by one after the damage.
Pay special attention to the cross-campaign bleed and brand contamination checks. Branded searches leaking into non-brand campaigns quietly inflate the non-brand campaign’s reported performance — which then misleads every budget decision you make on top of it.
Tip: Export both your search terms report AND your existing negative keyword lists. Claude can find gaps only if it knows what you already block.
05 · Diagnostics
Impression Share Gap Finder
Identifies exactly where you’re losing impression share — and whether the cause is budget, rank, or both. Most advertisers leave 30–50% of available impressions on the table. This skill calculates the revenue opportunity of closing each gap and prioritizes which campaigns to fund first.
This is the growth-side diagnostic — the other four find waste, this one finds volume you’re not buying. The budget-vs-rank split is the decision that matters: IS lost to budget is fixed with money (and the Budget Reallocation Model in skill 08 tells you where to take it from), while IS lost to rank is fixed with Quality Score and bid work, and no budget increase will help.
Take the “deprioritize” bucket seriously. Not every gap deserves closing — a campaign with a weak conversion rate and 40% lost IS is a hole, not an opportunity, and funding it is how accounts scale their waste along with their spend.
Tip: Include impression share columns (search IS, IS lost to budget, IS lost to rank) when exporting campaign data. These metrics are hidden by default in Google Ads.
Tools like Ryze AI automate this process — adjusting bids, reallocating budget, and flagging underperformers 24/7 without manual intervention, with approval controls for anything you’d rather sign off on yourself. Ryze AI clients see an average 3.8x ROAS within 6 weeks of onboarding.





Free SEO/GEO audit
- Surface technical SEO issues
- Spot quick wins
- Find duplicate and thin pages
Free · no credit card · instant
Optimization skills: fix what’s broken
Once you’ve diagnosed the problems, optimization skills tell you exactly what to change — and how. Each skill outputs actionable recommendations with expected impact estimates so you can prioritize by ROI. These 5 skills cover the optimizations that drive 80% of Google Ads improvement: negative keywords, bids, budgets, ad copy, and landing page alignment.
A rule that keeps these five honest: one change category per week. If you ship new negatives, a bid strategy switch, a budget shift, and fresh ads in the same seven days, and performance moves, you’ve learned nothing about which lever did it. Sequence the fixes in the order the diagnostics ranked them, give automated bidding room to re-learn after each, and keep a change log — the reporting skills in the next section will cross-reference it.
06 · Optimization
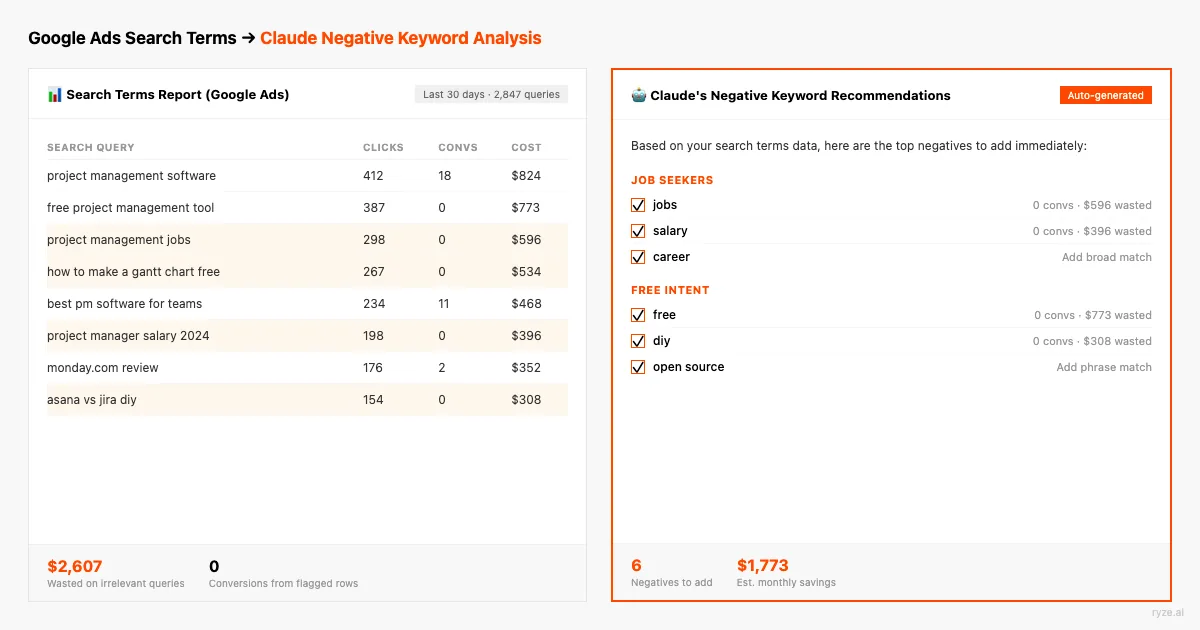
Start hereNegative Keyword Mining
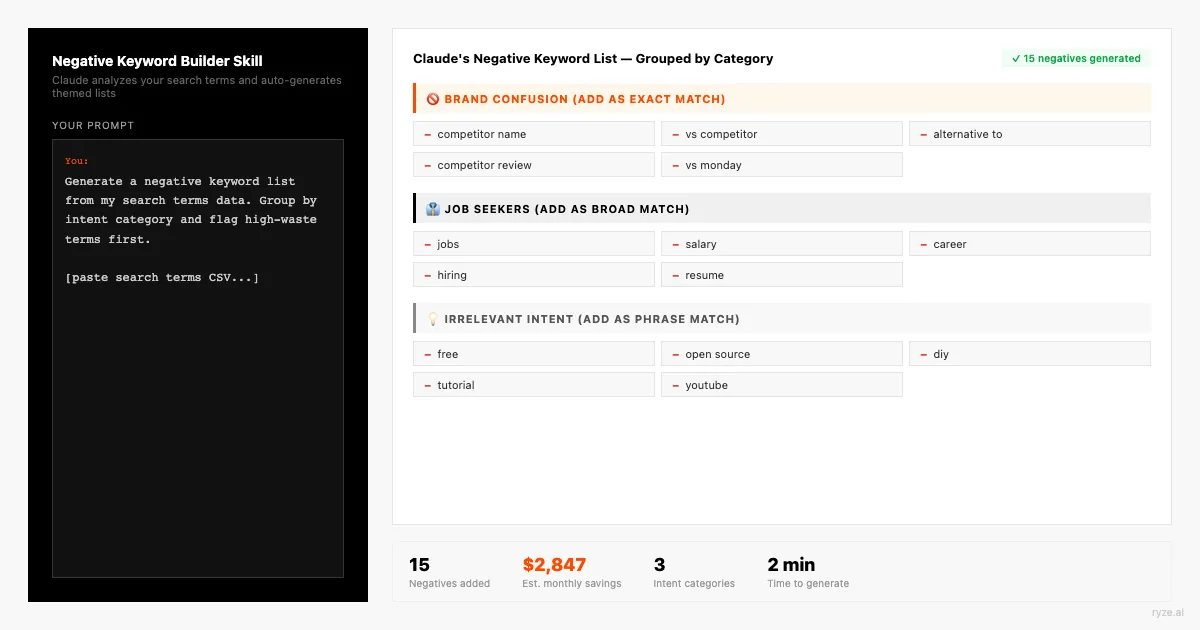
Generates a comprehensive negative keyword list from your search terms data, industry knowledge, and semantic analysis. Goes beyond simple waste identification — it proactively suggests negatives you haven’t triggered yet based on your keyword themes. Well-maintained negative keyword lists reduce wasted spend by 15–30%.
The proactive angle is the difference between this and the two diagnostic skills that also produce negatives: those react to money already spent, this one predicts. If you sell enterprise software, you already know “free,” “crack,” and “tutorial” searches will eventually find you — blocking them before launch is cheaper than after. Run this once per new campaign, before it spends a dollar.
Organize the output into shared negative lists in Google Ads (Tools → Shared library), not campaign-level one-offs: one “universal junk” list, one per-theme list. That way the next campaign you launch inherits the protection automatically.
Tip: Describe your business in detail. The more Claude knows about what you sell, the better it can identify irrelevant terms proactively.
07 · Optimization
Bid Strategy Selector
Evaluates your current bid strategy against alternatives and recommends the optimal approach based on your conversion volume, budget, and goals. Google offers 7 automated bid strategies — choosing the wrong one costs 15–40% in performance. This skill matches strategy to account maturity.
Conversion volume is the gating factor most advertisers ignore: Target CPA on a campaign with 12 conversions a month gives the algorithm nothing to learn from, and it will swing wildly. That’s why the prompt checks volume thresholds before anything else — the right strategy for your stage beats the theoretically best strategy every time.
Whatever it recommends, honor the transition plan. Switching bid strategies resets learning; expect one to two weeks of noisy performance and don’t judge the new strategy — or switch again — inside that window. The forecast skill (15) can model what the settled state should look like so you know what “working” means before you flip the switch.
Tip: Include at least 90 days of campaign data. Bid strategy recommendations need historical conversion volume and variance data to be accurate.
08 · Optimization
Budget Reallocation Model
Analyzes performance across all campaigns and builds a reallocation plan that shifts spend from low-performers to high-performers. Most accounts have 20–40% of budget trapped in underperforming campaigns. This skill models the impact of reallocation before you make changes — showing projected conversions and ROAS at different budget splits. For the Meta-side version of this and the other cross-platform skills, see Claude marketing skills for Google & Meta ads.
The three-scenario structure exists so you can act the same day: conservative shifts are safe to ship on the model’s word alone, while the aggressive scenario is a hypothesis to test over a month. Implement in steps — Google’s own guidance is to avoid budget changes larger than about 20% at once on automated bidding, or you re-trigger learning on both the donor and recipient campaigns.
Re-run the model two weeks after implementing and compare projected vs actual. The delta tells you how much to trust the next projection — and feeding the comparison back in (“last time you projected X, actual was Y, recalibrate”) measurably tightens round two.
Tip: Include impression share data. Campaigns with IS lost to budget are the best candidates for additional spend — they already convert well but are starved for volume.
09 · Optimization
Ad Copy A/B Generator
Generates responsive search ad variations optimized for your keywords, audience, and competitive landscape. Google requires 15 headlines and 4 descriptions per RSA — most advertisers reuse the same messaging. This skill creates differentiated variations using proven copywriting frameworks (PAS, AIDA, social proof) and pins them strategically.
The competitor-ads input is the highest-leverage field in the prompt. Search your own top three keywords in an incognito window, copy what the ads above and below you say, and paste it in. Claude writing against the live auction produces headlines that differentiate; Claude writing blind produces headlines that sound like everyone else’s.
Check every headline against the 30-character limit before uploading — ask Claude to print the character count next to each line and rewrite any that exceed it. And resist over-pinning: pin position 1 for compliance or brand rules if you must, but each additional pin removes combinations Google can test. For scaling creative production beyond a single ad group, see automated ad creation.
Tip: Paste your competitors' ads (search for your keywords and screenshot the results). Claude writes better copy when it knows what the market is already saying.
10 · Optimization
Landing Page Match Scorer
Evaluates how well your landing pages align with the keywords and ads driving traffic to them. Keyword-to-landing-page mismatch is the #1 cause of low Quality Scores and high bounce rates. This skill scores each landing page on relevance, intent match, and conversion optimization — then tells you what to change.
This is the skill that closes the loop the Quality Score Analysis opens: when skill 03 says “Landing page experience: below average,” this one tells you which of the seven dimensions is failing and hands you the rewrite. The double weighting on message match and intent is deliberate — a fast, pretty page that answers the wrong question still converts at zero.
Work pages in order of spend, not score. A page scoring 5/10 with $8,000/month behind it outranks a 3/10 page getting $200. And after shipping the changes, give it two weeks and check both numbers moved: Quality Score’s landing page component in Google Ads, and conversion rate for the ad groups pointing at that page.
Tip: If using MCP, Claude can fetch your landing page directly. Otherwise, paste the full page text — headers, body copy, CTA text, and form fields.
Reporting skills: communicate results clearly
Reporting skills turn raw Google Ads data into narratives your team, clients, or C-suite can act on. The average PPC manager spends 5–8 hours per week on reporting. These 5 skills reduce that to under 30 minutes — and produce more actionable reports than most humans write.
They also compound with the first ten skills: a weekly digest that flags an anomaly feeds the CPA Spike Diagnosis; a benchmark report that shows a competitor gaining share feeds the Impression Share Gap Finder. Reporting isn’t the end of the loop — it’s the trigger for the next diagnostic run. These are also the first skills worth scheduling, since they run on a calendar rather than on a symptom.
11 · Reporting
Start hereWeekly Performance Digest
Generates a structured weekly report with trend analysis, anomaly flags, and next-week action items. Includes week-over-week and month-over-month comparisons. Designed to be sent directly to stakeholders without editing — uses plain language, not jargon.
The same-week-last-month column is what saves you from the classic Monday panic: conversions “down 18% week over week” is often just a normal monthly rhythm, and the second comparison exposes that in one glance. The action-items section is the part to hold to a standard — if an item isn’t specific enough that someone could do it Tuesday morning, send it back: “rewrite action item 2 as a concrete task with an owner.”
Run it the same morning every week with the same export structure and keep the outputs in one thread or folder. Ten weeks of identical-format digests become their own dataset — paste two or three back in and ask what’s trending that no single week showed.
Tip: Export this week and last week as separate CSVs with identical column structure. Include a note about any known changes (new campaigns launched, paused ads, budget shifts).
12 · Reporting
Anomaly Detection Alert
Scans your account for statistical anomalies — metrics that deviate from their historical baseline by more than 2 standard deviations. Catches problems that daily monitoring misses: gradual CPC creep, slow conversion rate decay, impression share erosion. Most anomalies are invisible until they’ve been bleeding budget for 7–14 days.
The trend-drift check matters more than the spike check. Spikes announce themselves; a conversion rate that slips 1% a week never does, and by the time the monthly report shows it you’ve funded six weeks of decay. Statistical baselines catch the slide in week two.
Triage the output like a pager: Critical means investigate today (hand it straight to the CPA Spike Diagnosis with the anomaly named), Warning means verify the data first — conversion lag and tracking gaps produce false 2-SD alarms — and Watch items just go in the notes for next week’s digest. If everything comes back “no anomalies,” that’s a good week, not a wasted run.
Tip: Daily-level data for 60 days gives Claude enough history to calculate meaningful baselines. Weekly data is too coarse for anomaly detection.
13 · Reporting
Executive Summary Generator
Creates a one-page executive summary from your Google Ads data — written for CMOs and VPs who have 2 minutes and need the “so what.” Translates PPC jargon into business impact: not “CPA dropped 12%” but “we’re acquiring customers for $8 less each, saving $4,200/month at current volume.”
The business-context bracket is doing more work than it looks like. “B2B SaaS, $99/month product, sales cycle 45 days, board cares about pipeline” produces a completely different summary than the same data with no context — because “what worked” depends on what the business is trying to do. Two sentences of context is the cheapest quality upgrade in this whole guide.
Before forwarding, verify the headline stat against the platform yourself. It’s the one number your CEO will repeat in the next meeting, and it should be bulletproof. Everything else in the summary can be directional; that line cannot.
Tip: Tell Claude who will read this summary. “Write for a CEO who cares about revenue” produces different output than “write for a CMO who cares about brand awareness.”
14 · Reporting
Competitor Benchmark Report
Analyzes your auction insights data alongside industry benchmarks to show how you stack up against competitors. Answers the questions advertisers ask most: “Are we paying too much?” “Are our competitors outspending us?” “Where are we winning and losing?” The average Google Ads industry CPC varies from $1.16 (ecommerce) to $6.75 (legal) — context matters.
Benchmarks are for calibration, not judgment: being 30% above the industry-average CPC is fine if your conversion rate is double the norm, and being under benchmark on everything can just mean you’re buying cheap junk traffic. Read the three benchmark verdicts together, never one at a time. Current per-industry numbers to feed the prompt are in the 2026 Google Ads cost benchmarks by industry.
Watch the competitor set itself over consecutive runs, not just the metrics. A new domain entering auction insights above 20% overlap is earlier warning than any CPC movement — and it usually shows up here a month before it shows up in your costs.
Tip: Export the Auction Insights report at the campaign level. Include both search and shopping auction insights if you run both campaign types.
15 · Reporting
ROAS Forecasting Model
Projects your ROAS for the next 30, 60, and 90 days based on historical trends, seasonality, and planned changes. Helps answer the budget question every advertiser faces: “If I increase spend by 25%, will ROAS hold or decline?” The model accounts for diminishing marginal returns — the curve that makes doubling budget rarely double results.
Treat the confidence intervals as the real output. A point forecast (“ROAS will be 3.4x”) is false precision from 90 days of data; the optimistic-expected-pessimistic band is what you can actually plan a budget around. If the pessimistic case at +25% spend still clears your target, scale with confidence. If only the optimistic case does, you’re gambling.
List planned changes honestly — a promo week, a landing page relaunch, a new competitor you spotted in auction insights. The model can only account for what you tell it, and an unmentioned Black Friday will make any forecast look broken. Score forecast-vs-actual each month; the error trend tells you when the model has earned bigger budget decisions.
Tip: 90 days of daily data is ideal for seasonality detection. If you have year-over-year data, include it — Claude can identify annual patterns like Q4 spikes or summer dips.
Quick Google Ads prompts: no skill file needed
Not every job deserves a full skill. When you need an answer in the next five minutes — a fast audit, a batch of headlines, a triage of yesterday’s search terms — a short, well-scoped Google Ads prompt does the work. These eight are the ones worth keeping on hand. Each is self-contained: paste it into any Claude chat, attach the export it names (or let an MCP connection supply the data), and fill the brackets. If one earns a weekly slot in your routine, promote it to a skill.
One-prompt account audit
The fastest useful overview of an account you've never seen — or one you've stared at too long.
Search terms triage
Three buckets, one decision each. Run it on Monday with last week's terms.
Keyword expansion by intent
New keyword ideas grouped by where the buyer is, not alphabetically.
RSA headlines in 60 seconds
A full RSA's worth of copy with character counts you can verify at a glance.
Performance Max health check
PMax hides a lot. This prompt squeezes the reports Google does expose.
Budget sanity check
Two questions every account should answer monthly: who's capped, and who's coasting.
Segment killer finder
Day, hour, device, location — somewhere in there a segment is quietly overpaying.
GAQL query writer
For API and Claude Code users: a correct GAQL query, explained clause by clause.
Working at the API level — keyword volumes, historical metrics, programmatic pulls? See using the Google Ads API and Keyword Planner with Claude.
Claude skills for PPC: the same system beyond Google Ads
Show ↓
Everything above is a Google Ads implementation of a channel-agnostic idea. Claude skills for PPC work anywhere the platform exports performance data: Meta Ads, Microsoft Ads, LinkedIn Ads, Amazon Ads. The skill structure — role, required inputs, step-by-step method, fixed output format — doesn’t change. What changes is the data you feed it and the platform mechanics the prompt references.
The translations are mostly mechanical. The Wasted Spend Audit reads placements, audiences, and creative-level breakdowns on Meta instead of search terms. The CPA Spike Diagnosis swaps Quality Score for creative fatigue and frequency. The Bid Strategy Selector maps to Meta’s bid strategies and Advantage+ decisions, or Microsoft’s near-identical automated bidding menu. Microsoft Ads is the easiest port of all — its exports are close enough to Google’s that most of the 15 prompts run unchanged. The reporting skills are the most portable: a weekly digest, an anomaly scan, and an exec summary are platform-blind by design, and the strongest version runs them across channels in one pass, so the report says “shift budget from Meta prospecting to Google brand” instead of describing each silo separately.
Two rules keep cross-channel skills honest. First, keep one skill file per channel rather than one mega-skill — metric names differ (ROAS vs purchase ROAS, impression share vs auction overlap), and a skill that hedges across platforms outputs mush. Second, when comparing channels, normalize to the money metrics (CPA, ROAS, contribution) and ignore platform-flattering metrics like Meta’s attributed view-through conversions until you’ve decided how to count them.
The Meta translations of all 15 skills are written out in Claude skills for Meta ads, the combined system in the Google + Meta marketing skills guide, and if you’re choosing a model to run them on, Claude Fable 5 for Google and Meta ads covers what the newest model changes for ad work.
For how Claude-based setups compare with the rest of the market, see the top AI tools for Google Ads management in 2026.
The Google Analytics skill: close the measurement loop
Show ↓
Every skill so far reads what Google Ads says about itself. That’s one witness. A Google Analytics Claude skill cross-examines it: GA4 sees what happened after the click — engagement, funnel progress, revenue — and it counts conversions differently than Google Ads does (different attribution, different counting rules, different treatment of consent-blocked traffic). The gap between the two numbers isn’t an error; it’s information. This skill extracts it.
Export from GA4: a traffic acquisition report (session source/medium) and a landing page report, both with engagement and conversion columns, same date range as your Google Ads export. Attach both plus the Ads campaign export and run:
16 · Measurement
Bonus skillGA4 Cross-Check
A second measurement pass worth running quarterly pairs Search Console with your search terms report — the paid-vs-organic overlap question every finance team eventually asks:
Both of these run hands-free once Claude has live access to GA4 and Search Console alongside Google Ads — that’s the same MCP connection covered next.
How do you connect Claude to Google Ads for live data?
All 15 skills above work with exported CSV data — no API connection needed. But if you want Claude to pull live campaign metrics, query search terms in real time, and check impression share without manual exports, you need MCP (Model Context Protocol).
MCP is a universal adapter that lets Claude call Google Ads API tools directly inside the conversation. Instead of downloading and uploading CSVs, you ask Claude “pull my campaign performance for the last 7 days” and it returns live data. Setup takes 2 minutes with the Ryze AI managed MCP connector — documented in the Google Ads integration docs — or 30 minutes if you self-host an open-source server.
With MCP connected, the diagnostic skills become especially powerful. The CPA Spike Diagnosis skill can pull data from the last 48 hours and compare it to the prior 30-day baseline — all in one conversation, no exports needed. The Anomaly Detection Alert skill can check every campaign daily and flag statistical outliers before they become expensive problems. For a step-by-step walkthrough with screenshots, see connecting Claude to Google Ads step by step; for the connector options compared, see the best Claude connector for Google Ads.
Two practical notes before you connect. Start read-only: every skill in this guide is an analysis skill, and read scope is all they need — what access the connector grants is spelled out before you approve it — so add write access later, deliberately, once you trust the loop. And expect the first session to be calibration: ask Claude to list the accounts and campaigns it can see and to pull one number you already know (yesterday’s spend) before you trust it with anything bigger.
CSV exports
Best for weekly audits and one-off analysis. No setup required. Upload any Google Ads report as CSV.
MCP connector
Best for daily monitoring, real-time diagnostics, and teams managing $50K+/month. 2-minute setup via Ryze AI.
Ryze AI autonomous
Best for teams that want 24/7 optimization without any prompts. Ryze AI runs diagnostics, makes bid changes, and reallocates budgets automatically. Average 3.8x ROAS within 6 weeks.
Where to run the skills: Claude Code, claude.ai, or Cowork
The prompts are surface-agnostic, but where you run them changes how much of the loop is automatic. Three setups, in increasing order of automation:
claude.ai — Projects
Create a Project, paste each skill into the project knowledge (one document per skill), and set project instructions with your business context so you never re-type it. Attach CSVs per conversation, or use connectors for live data. Best for: marketers who live in the browser and run skills on demand.
Claude Code — skill files
Save each skill as a SKILL.md file in its own folder under ~/.claude/skills, with a name and description in the frontmatter. Claude Code picks the right skill up when the task matches, or you invoke it by name. Pair with a Google Ads MCP server and the skill queries the account directly. Best for: operators comfortable in a terminal who want skills + live data + scriptability.
Claude Cowork — scheduled
Take the skills that run on a calendar — the Weekly Performance Digest, the Anomaly Detection Alert, the monthly benchmark and forecast — and schedule them as recurring runs so the analysis lands in front of you without anyone remembering to ask. Best for: making the reporting layer fully hands-free.
A sensible progression: start in claude.ai with CSVs (day one, zero setup), move to Claude Code with MCP once the skills earn a weekly slot, then schedule the recurring ones. Whichever surface you choose, keep the skill text in version control or a shared doc — the skills improve as you fold in lessons (“always check conversion lag before flagging a drop”), and those edits should reach the whole team, not one person’s chat history.
The Claude Code route in depth — skill files, MCP config, and chained workflows — is covered in Claude Code marketing workflows for Google and Meta ads. Ready-made skill files you can download instead of assembling by hand are in the Claude skills library.
Troubleshooting: when a skill returns a bad answer
Skills fail in predictable ways, and nearly all of them are input problems. The five failure modes worth knowing, with the fix for each:
The numbers don't match the platform
Usually a truncated CSV, a totals row mixed into the data, or two exports with different date ranges. State the exact range in the prompt, strip summary rows before attaching, and ask Claude to show its arithmetic for any computed metric so you can spot where it diverged.
Costs are 1,000,000x too large
API and MCP data returns cost in micros — Google's unit, not an error. Add one line to any skill that touches API data: "cost fields are in micros; divide by 1,000,000 before reporting."
The advice is generic
If the output could apply to any account, the input lacked business context. Add two sentences — what you sell, who buys, target CPA — and the same skill produces specific answers. This is the single most common failure.
It invented a metric or a feature
Constrain it: "use only the attached data; if something needed is missing, say so instead of estimating." For platform features that shipped recently, paste the relevant help-center text into the prompt rather than trusting training data to be current.
The output format drifts between runs
The skill text is too loose. Pin the format with an explicit skeleton ("output exactly these five sections, in this order") and keep one canonical copy of the skill — format drift usually means teammates are running paraphrased versions.
A 2-SD anomaly turned out to be nothing
Check conversion lag before reacting — recent days always under-report conversions that haven't landed yet. Have the anomaly skill exclude the last 2-3 days from conversion-based alarms, or annotate them as provisional.
The meta-rule: when a skill disappoints, fix the skill text, not just the conversation. Every failure above becomes one added line in the SKILL.md or project document — and then it never happens again, for anyone on the team. That accumulation is what makes a skill worth more every month you use it, where a prompt is worth the same forever.
Frequently asked questions
What are Claude skills for Google Ads?
Do I need MCP to use these skills?
How much time do these skills save?
Which Claude model works best for Google Ads?
Show 8 more questionsShow fewer questions
Can Claude make changes to my Google Ads account?
Are these prompts free to use?
What is the difference between a Claude skill and a regular prompt?
Can I use these Claude skills for PPC channels beyond Google Ads?
Is there a Claude skill for Google Analytics 4?
How do I run these skills in Claude Code?
Can Claude help with Performance Max campaigns?
Why does Claude sometimes get the numbers wrong?
Related guides
Connect Claude to Google Ads
Seven connectors compared; the two-minute Google-login route first.
Claude marketing skills, ranked by job
All 98 free skills across ads, SEO, CRO and content.
Connect Claude to Google, Meta, GA4 and Search Console
The screenshot walkthrough for every connection.
Claude skills for Shopify
Ten downloadable skills: CRO agent, refunds, LTV, pricing, SEO meta.